Variance is an essential statistical concept that measures the spread between numbers in a data set. Understanding variance is crucial in fields like finance, statistics, and data science, as it indicates how far data points deviate from the mean. This article explores what variance is, how to calculate it, its importance in various industries, and some tools that can simplify the process. If you’ve ever wondered how to find variance effectively or why it’s so widely used, this comprehensive guide has everything you need to know.
What Is Variance?
Variance measures the dispersion of data points relative to their mean, revealing how much the data points in a sample differ from the average. When values are close to the mean, the variance is low, while values far from the mean yield a high variance. Calculating variance is particularly valuable in financial analysis, quality control, and predictive analytics, as it helps in assessing risks, performance consistency, and predictions.
To measure variance, you first calculate the average of the data set, then determine the difference between each data point and the mean. Squaring these differences and taking the average of these squared values yields the variance. Knowing the formula and steps behind calculating variance is essential for applications across various industries.
The Formula for Variance
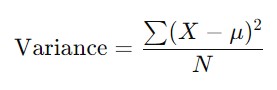
The formula for variance differs depending on whether you’re calculating the population variance or the sample variance. For a population variance, the formula is:
 where:
- X = each data point,
- μ\muμ = mean of the data set,
- NNN = number of data points in the population.
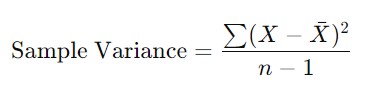
For a sample variance, the formula is slightly different:
Here, Xˉ is the sample mean, and nnn is the sample size. Dividing by n−1n – 1n−1 provides an unbiased estimator for the population variance when working with a sample. The formulas for both types of variance calculations are used in data science to make predictions, especially when building models that depend on data stability.
Steps to Calculate Variance
Calculating variance involves several specific steps. Here’s how to do it manually, though most people use tools like Excel or statistical software to automate the process.
- Calculate the Mean: Add up all data points, then divide by the number of data points.
- Find Differences from Mean: For each data point, calculate the difference from the mean.
- Square the Differences: Square each result to remove any negative values.
- Sum the Squared Differences: Add up all squared differences.
- Divide by Total Data Points or n−1: Use N for population variance or n−1 for sample variance.
These steps can quickly become tedious, especially with large data sets, making tools like SPSS or Tableau essential for professionals working with extensive data.
Importance of Variance in Data Analysis
Variance plays a critical role in data analysis, serving as a foundational element in various applications. For instance, in finance, variance helps in evaluating stock performance by showing the fluctuations around an average return. The higher the variance, the more unpredictable the stock’s returns, which investors use as an indication of risk. In statistics, variance is integral to hypothesis testing, where understanding data spread is vital for accurately interpreting data distributions.
In quality control, variance is used to ensure consistency in manufacturing processes. By monitoring variance, companies can detect and correct deviations from desired performance levels. Variance is also important in machine learning, where models are trained to minimize error variance, improving prediction accuracy. This wide applicability makes mastering variance essential for anyone working with data.
Uses of Variance Across Industries
- Finance: Variance aids in risk assessment by quantifying the volatility of asset returns, such as stocks, bonds, and other financial instruments.
- Manufacturing: By monitoring variance in production processes, companies ensure product quality and maintain consistency.
- Marketing: Variance in marketing metrics, such as conversion rates, reveals how effective a campaign is across different segments.
- Healthcare: Variance can help in identifying outliers in patient data, aiding in diagnostics and treatment plans.
- Education: In analyzing test scores, variance provides insights into student performance spread and identifies areas needing improvement.
These varied applications underscore why understanding how to find variance is a valuable skill across industries.
Tools for Calculating Variance
While variance can be calculated by hand, software tools simplify this process, especially for large data sets. Here are some of the most popular tools used for calculating variance:
- Excel: With built-in functions like VAR.P (population variance) and VAR.S (sample variance), Excel makes variance calculation accessible for many.
- SPSS: Known for handling complex statistical analysis, SPSS offers robust variance calculation features suited for research and academic applications.
- R and Python: Both of these programming languages provide packages that make variance calculation straightforward for data scientists.
- Tableau: Tableau is commonly used for data visualization but includes features for statistical analysis, such as calculating variance to illustrate data trends.
- SAS: This software, often used in business analytics, includes advanced variance and other statistical functions to support in-depth analysis.
Popular SaaS Products for Variance Calculation
Here are some excellent SaaS products that make calculating variance, and other data analysis tasks, much more manageable:
- DataRobot – A machine learning platform with powerful automated variance analysis tools for data-driven decision-making.
- Minitab – Known for its statistical analysis capabilities, Minitab is ideal for variance calculations in quality control and engineering applications.
- SPSS – An industry-standard tool for complex statistical analysis, including variance, suitable for researchers.
- Statwing – This intuitive tool offers statistical analysis, including variance, making it great for beginners and professionals alike.
- Tableau – Primarily a data visualization tool, but also includes variance calculation, particularly helpful in spotting trends and patterns.
- Google Sheets – With functions similar to Excel, Google Sheets is a flexible option for basic variance calculations and collaborative work.
- Mode – Mode offers powerful analytics tools with variance calculations for business intelligence and analysis.
- Looker – Now part of Google Cloud, Looker’s analytical tools include variance calculations, providing actionable insights.
Conclusion
Understanding and calculating variance is essential for anyone working with data, whether in finance, healthcare, marketing, or another field. Variance tells us how much data points diverge from the mean, offering insights into risk, quality, performance, and more. Knowing how to calculate and interpret variance enables better decision-making, enhances predictive accuracy, and provides a foundation for more advanced statistical analyses.
If you’re exploring variance and other statistical tools to enhance your workflow, Subscribed.FYI can be an invaluable resource. By consolidating insights on a range of SaaS products, Subscribed.FYI enables freelancers, agencies, and small teams to find and manage SaaS solutions tailored to their needs. The platform simplifies subscription management, offers side-by-side tool comparisons, and even provides exclusive deals—making it easy to manage and optimize your SaaS stack. Whether you’re calculating variance or using SaaS for other tasks, Subscribed.FYI provides everything needed to streamline operations and enhance productivity.
Relevant Links
- DataRobot
- Minitab
- SPSS
- Statwing
- Tableau
- Google Sheets
- Mode
- Looker
- Subscribed.FYI
- Subscribed.FYI Deals
These resources provide essential tools for variance calculations and subscription management. Visit each to explore features, pricing, and insights tailored to your needs.