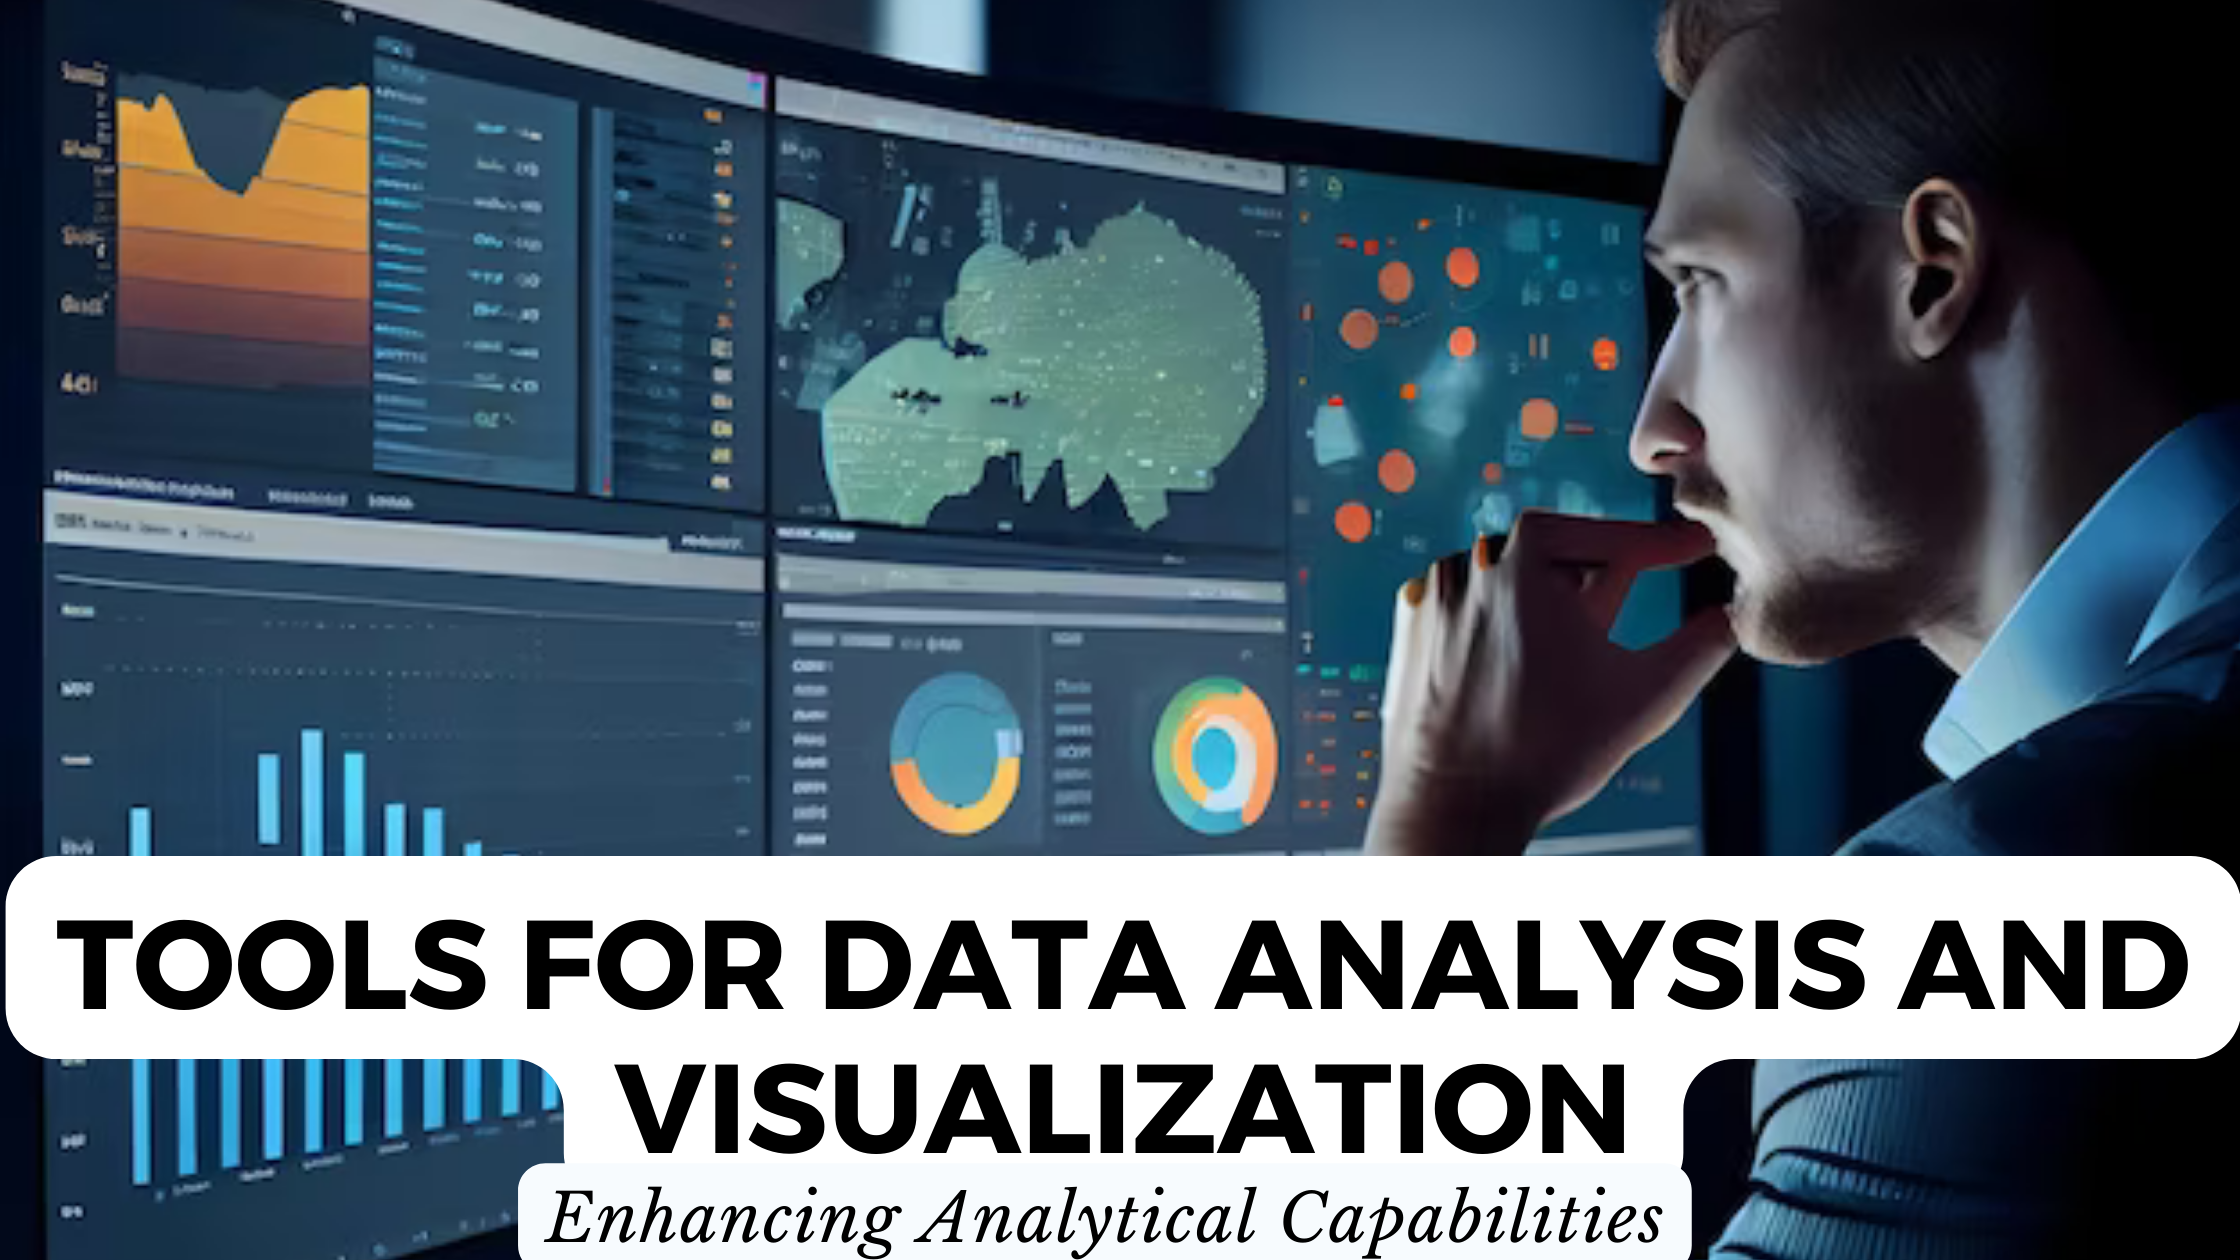
Tools for Data Analysis and Visualization: Enhancing Analytical Capabilities
- Data as a Service (DaaS) Software Marketing & Analytics


Tools for Data Analysis and Visualization: Enhancing Analytical Capabilities
In the dynamic landscape of data analysis and visualization, having the right tools is paramount. Businesses, analysts, and data enthusiasts are increasingly seeking powerful Software as a Service (SaaS) solutions to enhance their analytical capabilities. In this article, we explore some of the leading tools that answer the query: What are the tools for data analysis and visualization?
Unveiling the Power of Data Analysis and Visualization Tools
1. Tableau Public: Tableau
Tableau is synonymous with robust data visualization. Tableau Public, its free version, empowers users to create interactive and shareable dashboards. Visualizations created using Tableau Public can be embedded across websites, making data storytelling accessible to all.
2. Power BI: Microsoft Power BI
Microsoft’s Power BI is an end-to-end business intelligence solution. With its user-friendly interface and seamless integration with Microsoft products, Power BI allows users to analyze, visualize, and share insights across their organization, making data-driven decisions easier.
3. Looker: Looker
Looker offers a unique data exploration platform. It allows users to create and share reports, dashboards, and explorations, providing a collaborative environment for data analysis. Looker is known for its data modeling and exploration capabilities.
4. Google Data Studio: Google Data Studio
Part of the Google Marketing Platform, Data Studio enables the creation of customizable and shareable reports and dashboards. With seamless integration with other Google products, it’s a preferred choice for those already using the Google ecosystem.
5. Qlik Sense: Qlik
Qlik Sense is a business intelligence and data visualization tool. Its associative model allows users to explore and analyze data intuitively. Qlik Sense promotes data literacy by making data discovery and visualization accessible to everyone.
Navigating the World of Data with SaaS Solutions
- Tableau: Create interactive and shareable data visualizations effortlessly.
- Microsoft Power BI: End-to-end business intelligence for data-driven decision-making.
- Looker: Collaborative data exploration for enhanced analysis.
- Google Data Studio: Customizable and shareable reports within the Google ecosystem.
- Qlik: Intuitive data discovery and visualization for better insights.
Conclusion
Effective data analysis and visualization are pivotal in today’s data-driven era. The tools mentioned here represent the cutting edge of what’s available. As you embark on your analytical journey, consider Subscribed.FYI as your compass. Unlock exclusive deals with Subscribed.FYI Deals, ensuring that your exploration of analytical tools is not only insightful but also cost-effective.
Enhance your analytical capabilities: Tableau | Microsoft Power BI | Looker | Google Data Studio | Qlik
Access exclusive deals and insights at Subscribed.FYI and Subscribed.FYI Deals.


