Project management tools like , Notion, Basecamp, Lark, Slack, Asana and Trello.
AI chatbot tools like ChatGPT, Grok, Perplexity, Claude, Gemini and Copilot.
Marketing analytics platforms like Google Analytics, Similarweb and Semrush.
CRM systems like HubSpot, Apollo.io Pipedrive, Zoho CRM, and Salesforce.
VPNs, SSO providers, and password managers like NordVPN, Okta, and LastPass.
Email marketing and campaign tools like MailerLite, Instantly, and Mailchimp.
Website builders, hosting tools like Hostinger, Webflow, Framer, and Shopify
HR and recruiting software like ATS platforms, BambooHR, Workday, and Lever.
Automate finances with confidence like Quickbooks, Stripe, Brex, and Mercury.
Design and editing tools like Figma, Canva, Adobe Creative Cloud, CapCut.
Workflow automation tools like Zapier, Make, Clay, and Reclaim.ai.
No-code and AI-native dev tools like Cursor, Windsurf, Lovable and Bubble.
Chat to find tools, compare options,
Discover the best-performing
Visit Subgrowth and gain advantage and revenue through real human presence for your brand to enable AI.
Industries we have supported successfully since 2023.
How we help to win in AI
In today's data-driven business landscape, Reporting and Visualization tools are indispensable assets for organizations of all sizes, from small startups to large enterprises. These advanced business solutions empower companies across various industries to enhance their operations, boost...
In today's data-driven business landscape, Reporting and Visualization tools are indispensable assets for organizations of all sizes, from small startups to large enterprises. These advanced business solutions empower companies across various industries to enhance their operations, boost efficiency, and drive growth through insightful and actionable data analysis. With features such as interactive dashboards, real-time analytics, and customizable visualizations, Reporting and Visualization tools simplify complex datasets, making it easier for stakeholders to identify trends, patterns, and key performance indicators. These SaaS software solutions offer ease of use, scalability, and seamless integration with existing systems, ensuring that businesses can make informed, data-driven decisions quickly and confidently. By centralizing data and providing timely, accurate insights, these tools facilitate streamlined workflows, improved communication across teams, and proactive strategic planning. Whether you are a business executive, data analyst, or part of a growing enterprise, Reporting and Visualization tools are essential for transforming raw data into meaningful narratives that drive smarter decisions and sustainable growth. Explore our range of Reporting and Visualization products to discover how these business solutions can revolutionize your organization's decision-making processes and operational efficiency.
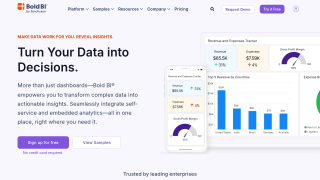
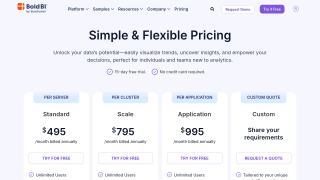
Bold BI by Syncfusion is a powerful analytics platform designed for seamless embedding into applications. It enables users to create interactive dashboards and gain actionable insights from over 150 data sources. With its modern architecture, user-friendly tools, and robust customization options, Bold BI empowers developers, analysts, and businesses across industries. Its flexible deployment and advanced features ensure accessible and secure analytics anywhere.
GoodData is an end-to-end analytics platform designed to transform raw data into actionable insights. It offers robust features like data integration, modeling, visualization, AI-driven analytics, and interactive dashboards, accessible through code or a no-code interface. With its scalable, API-first approach, GoodData supports seamless deployment across various environments, empowering organizations to make data-driven decisions. Trusted by over 140,000 businesses, it enables the creation of customized analytics solutions for both technical teams and end-users.
Power My Analytics is a reporting automation tool designed for digital marketers to seamlessly collect and integrate data from advertising, social media, email, shopping, and CRM platforms. It consolidates metrics into destinations like spreadsheets, analytics tools, and SQL databases, ensuring streamlined workflows and data integrity. With user-friendly templates and robust connectors, it saves time and enhances decision-making while offering unmatched cost-effectiveness.
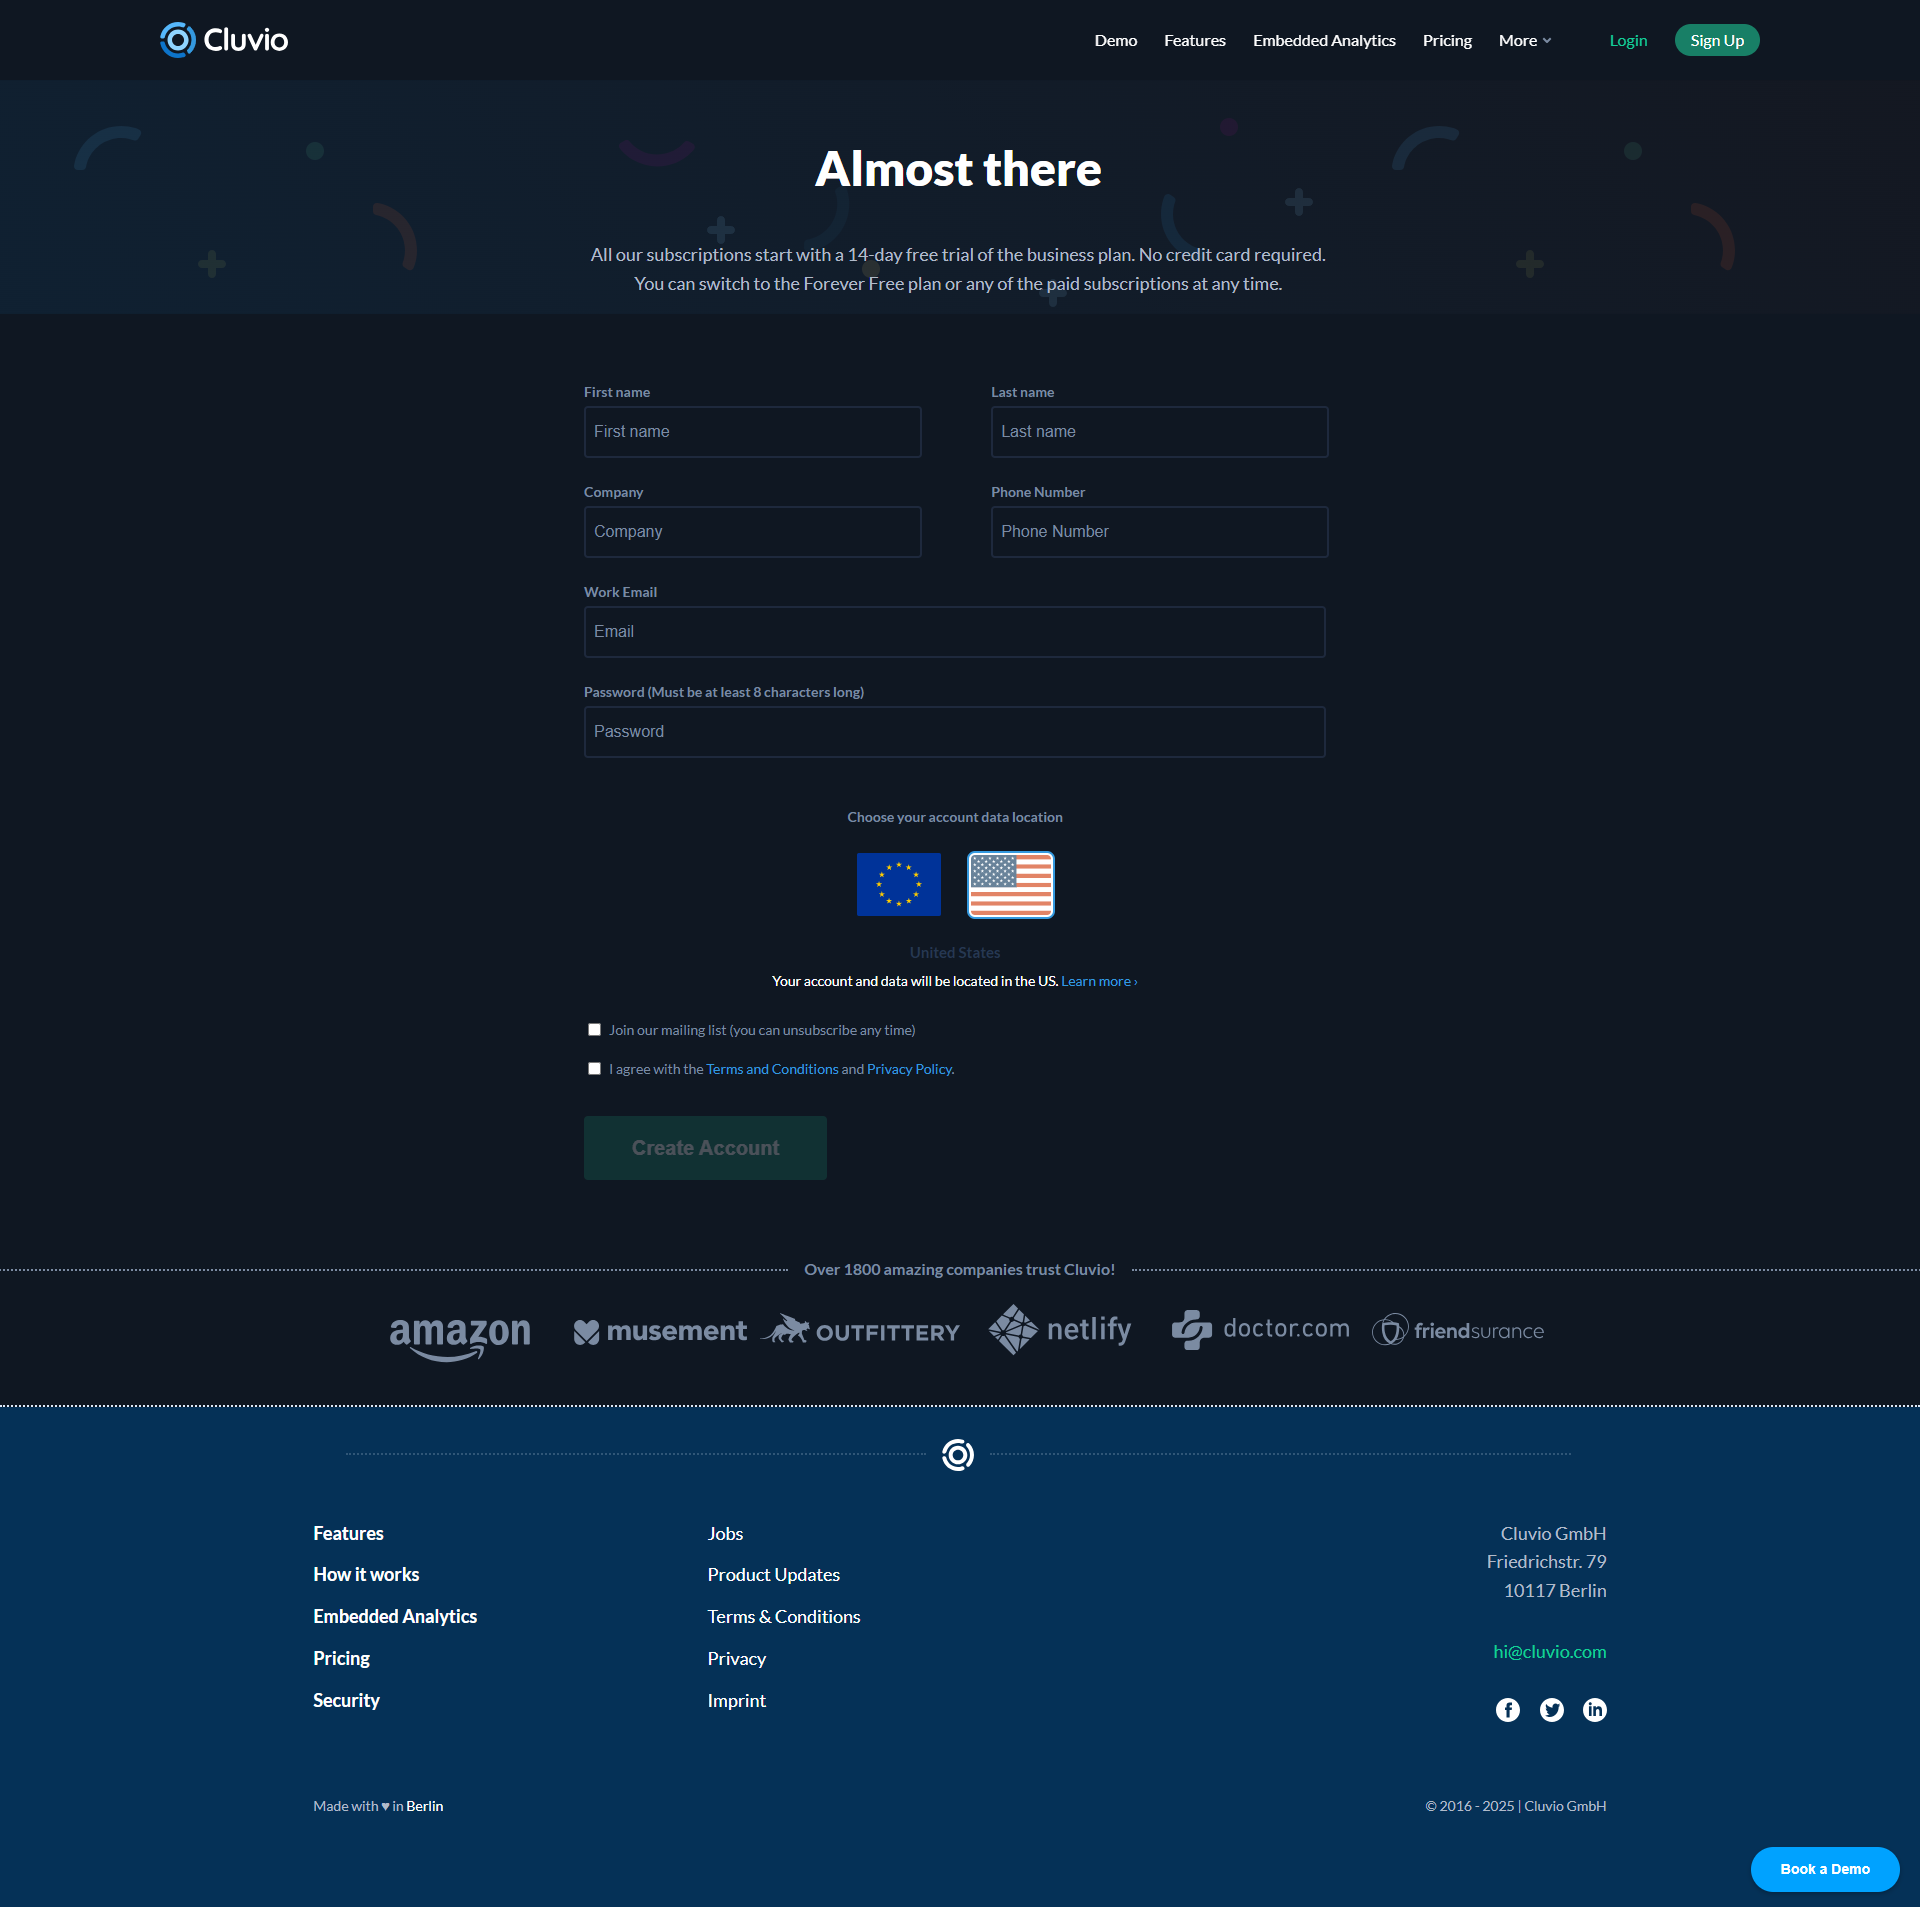
Cluvio is a user-friendly cloud analytics platform designed for startups and SMEs to quickly create visually appealing, SQL and R-based interactive dashboards. It enables seamless sharing of insights within teams or with customers and offers powerful embedding options for integrating analytics into web applications. With affordable pricing tiers and ease of use, Cluvio is perfect for businesses seeking efficient data visualization.
Geckoboard is a real-time dashboard tool designed to help teams display and share key metrics effortlessly. With a user-friendly drag-and-drop interface, it connects to over 90 tools like Google Analytics, Salesforce, and HubSpot to streamline data visualization. Ideal for office screens or remote sharing, it keeps teams aligned with live updates and customizable dashboards. Enhance clarity, engagement, and performance tracking with Geckoboard’s simple yet powerful features.
Looker, part of Google Cloud, is a powerful business intelligence platform designed for modern data analytics and visualization. It integrates data from diverse sources into a unified view, enabling teams to create interactive dashboards, share insights, and enhance decision-making. With a user-friendly interface, customizable visualizations, and a robust data modeling layer, Looker empowers organizations to harness the full potential of their data efficiently.
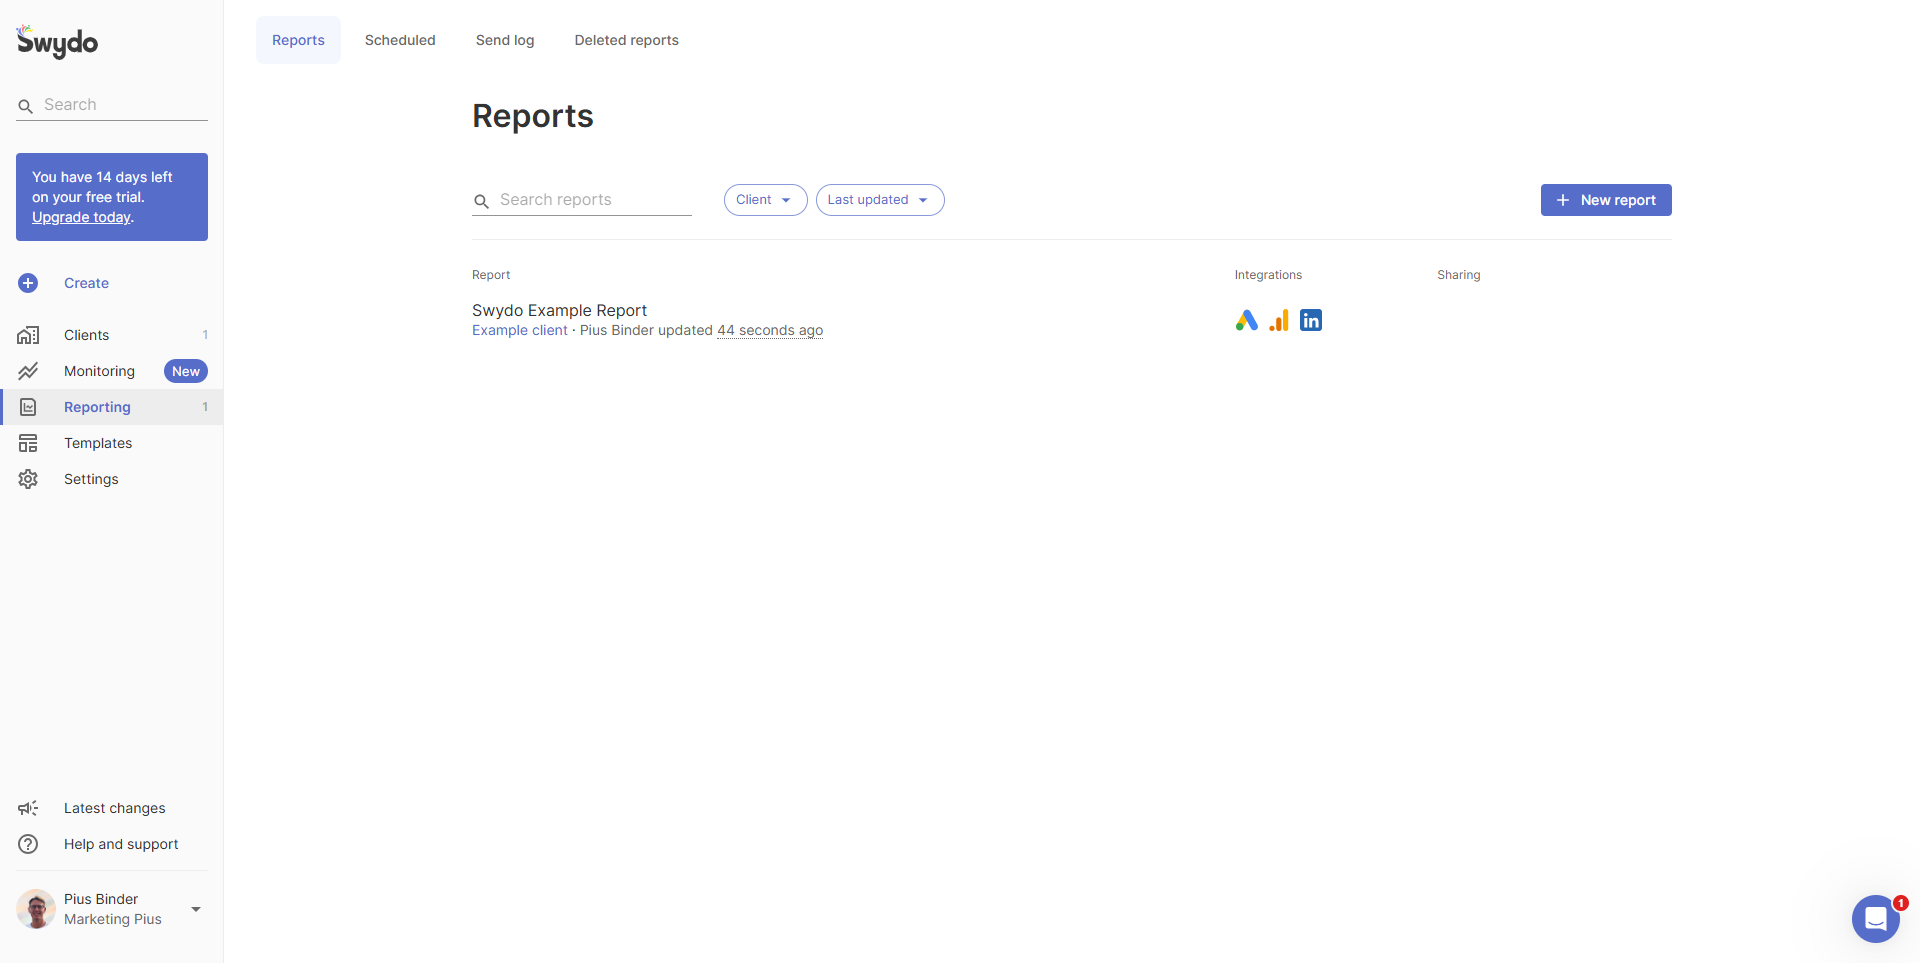
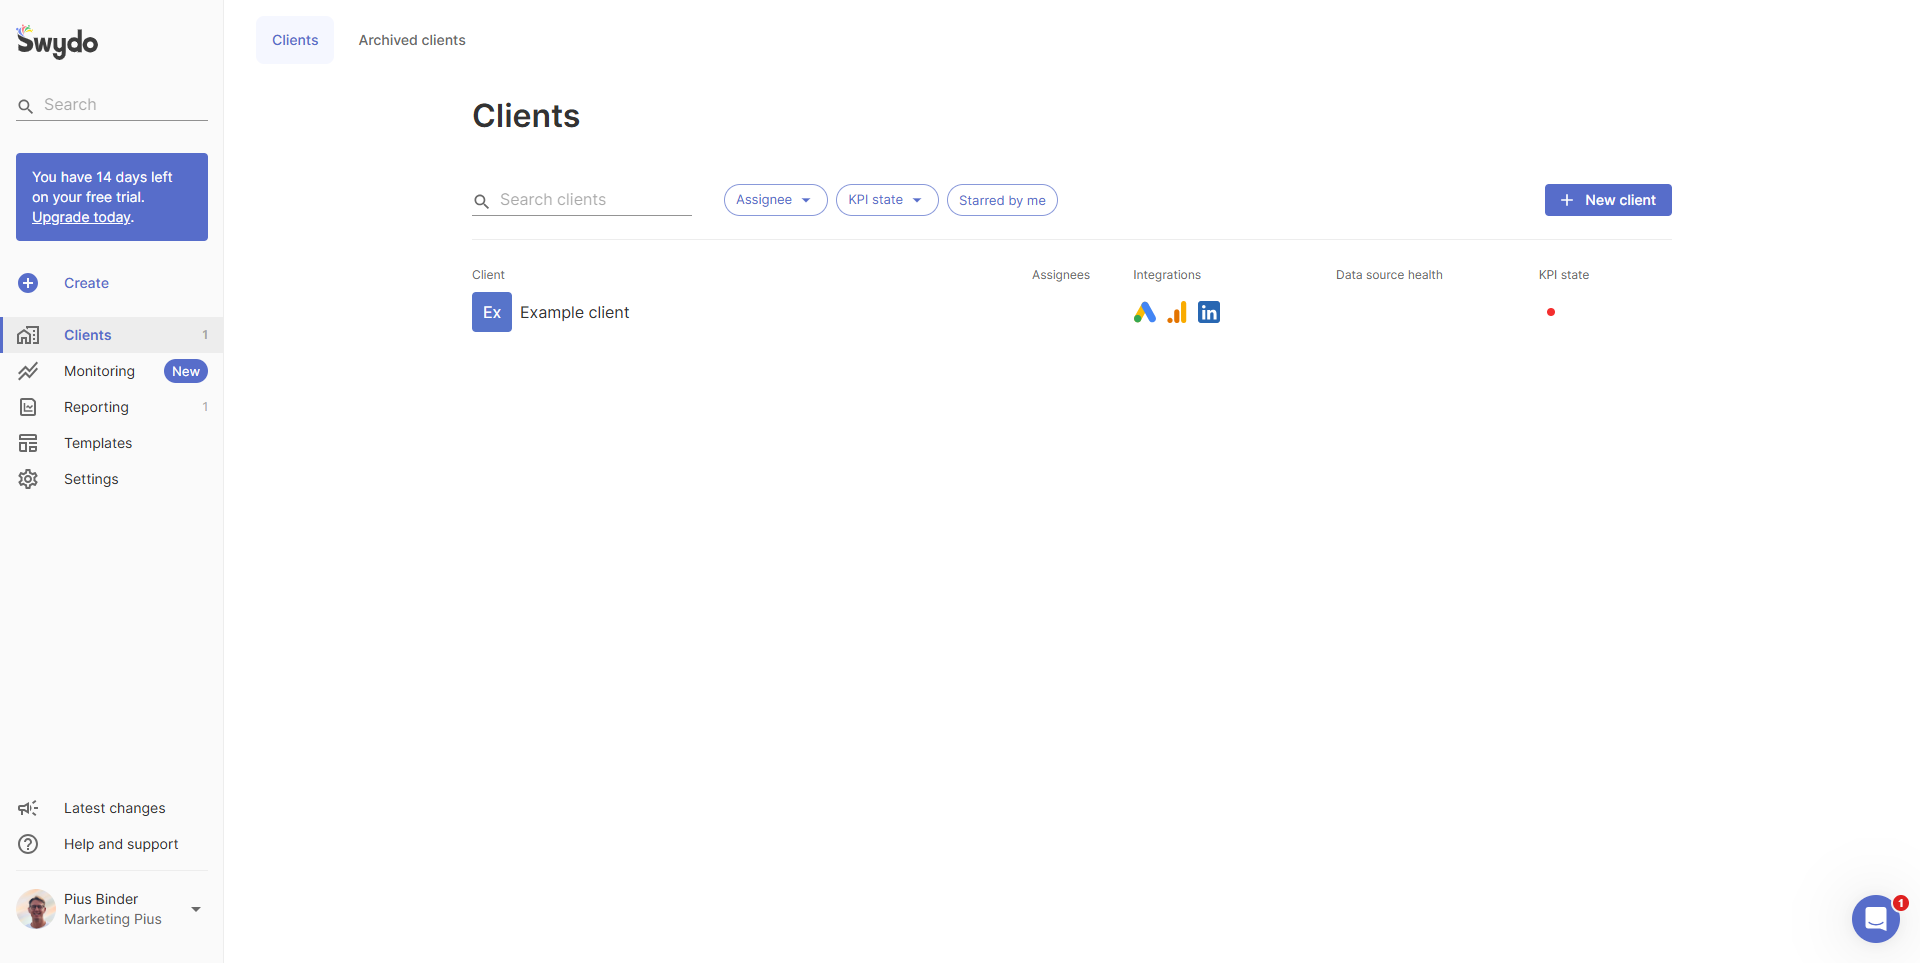
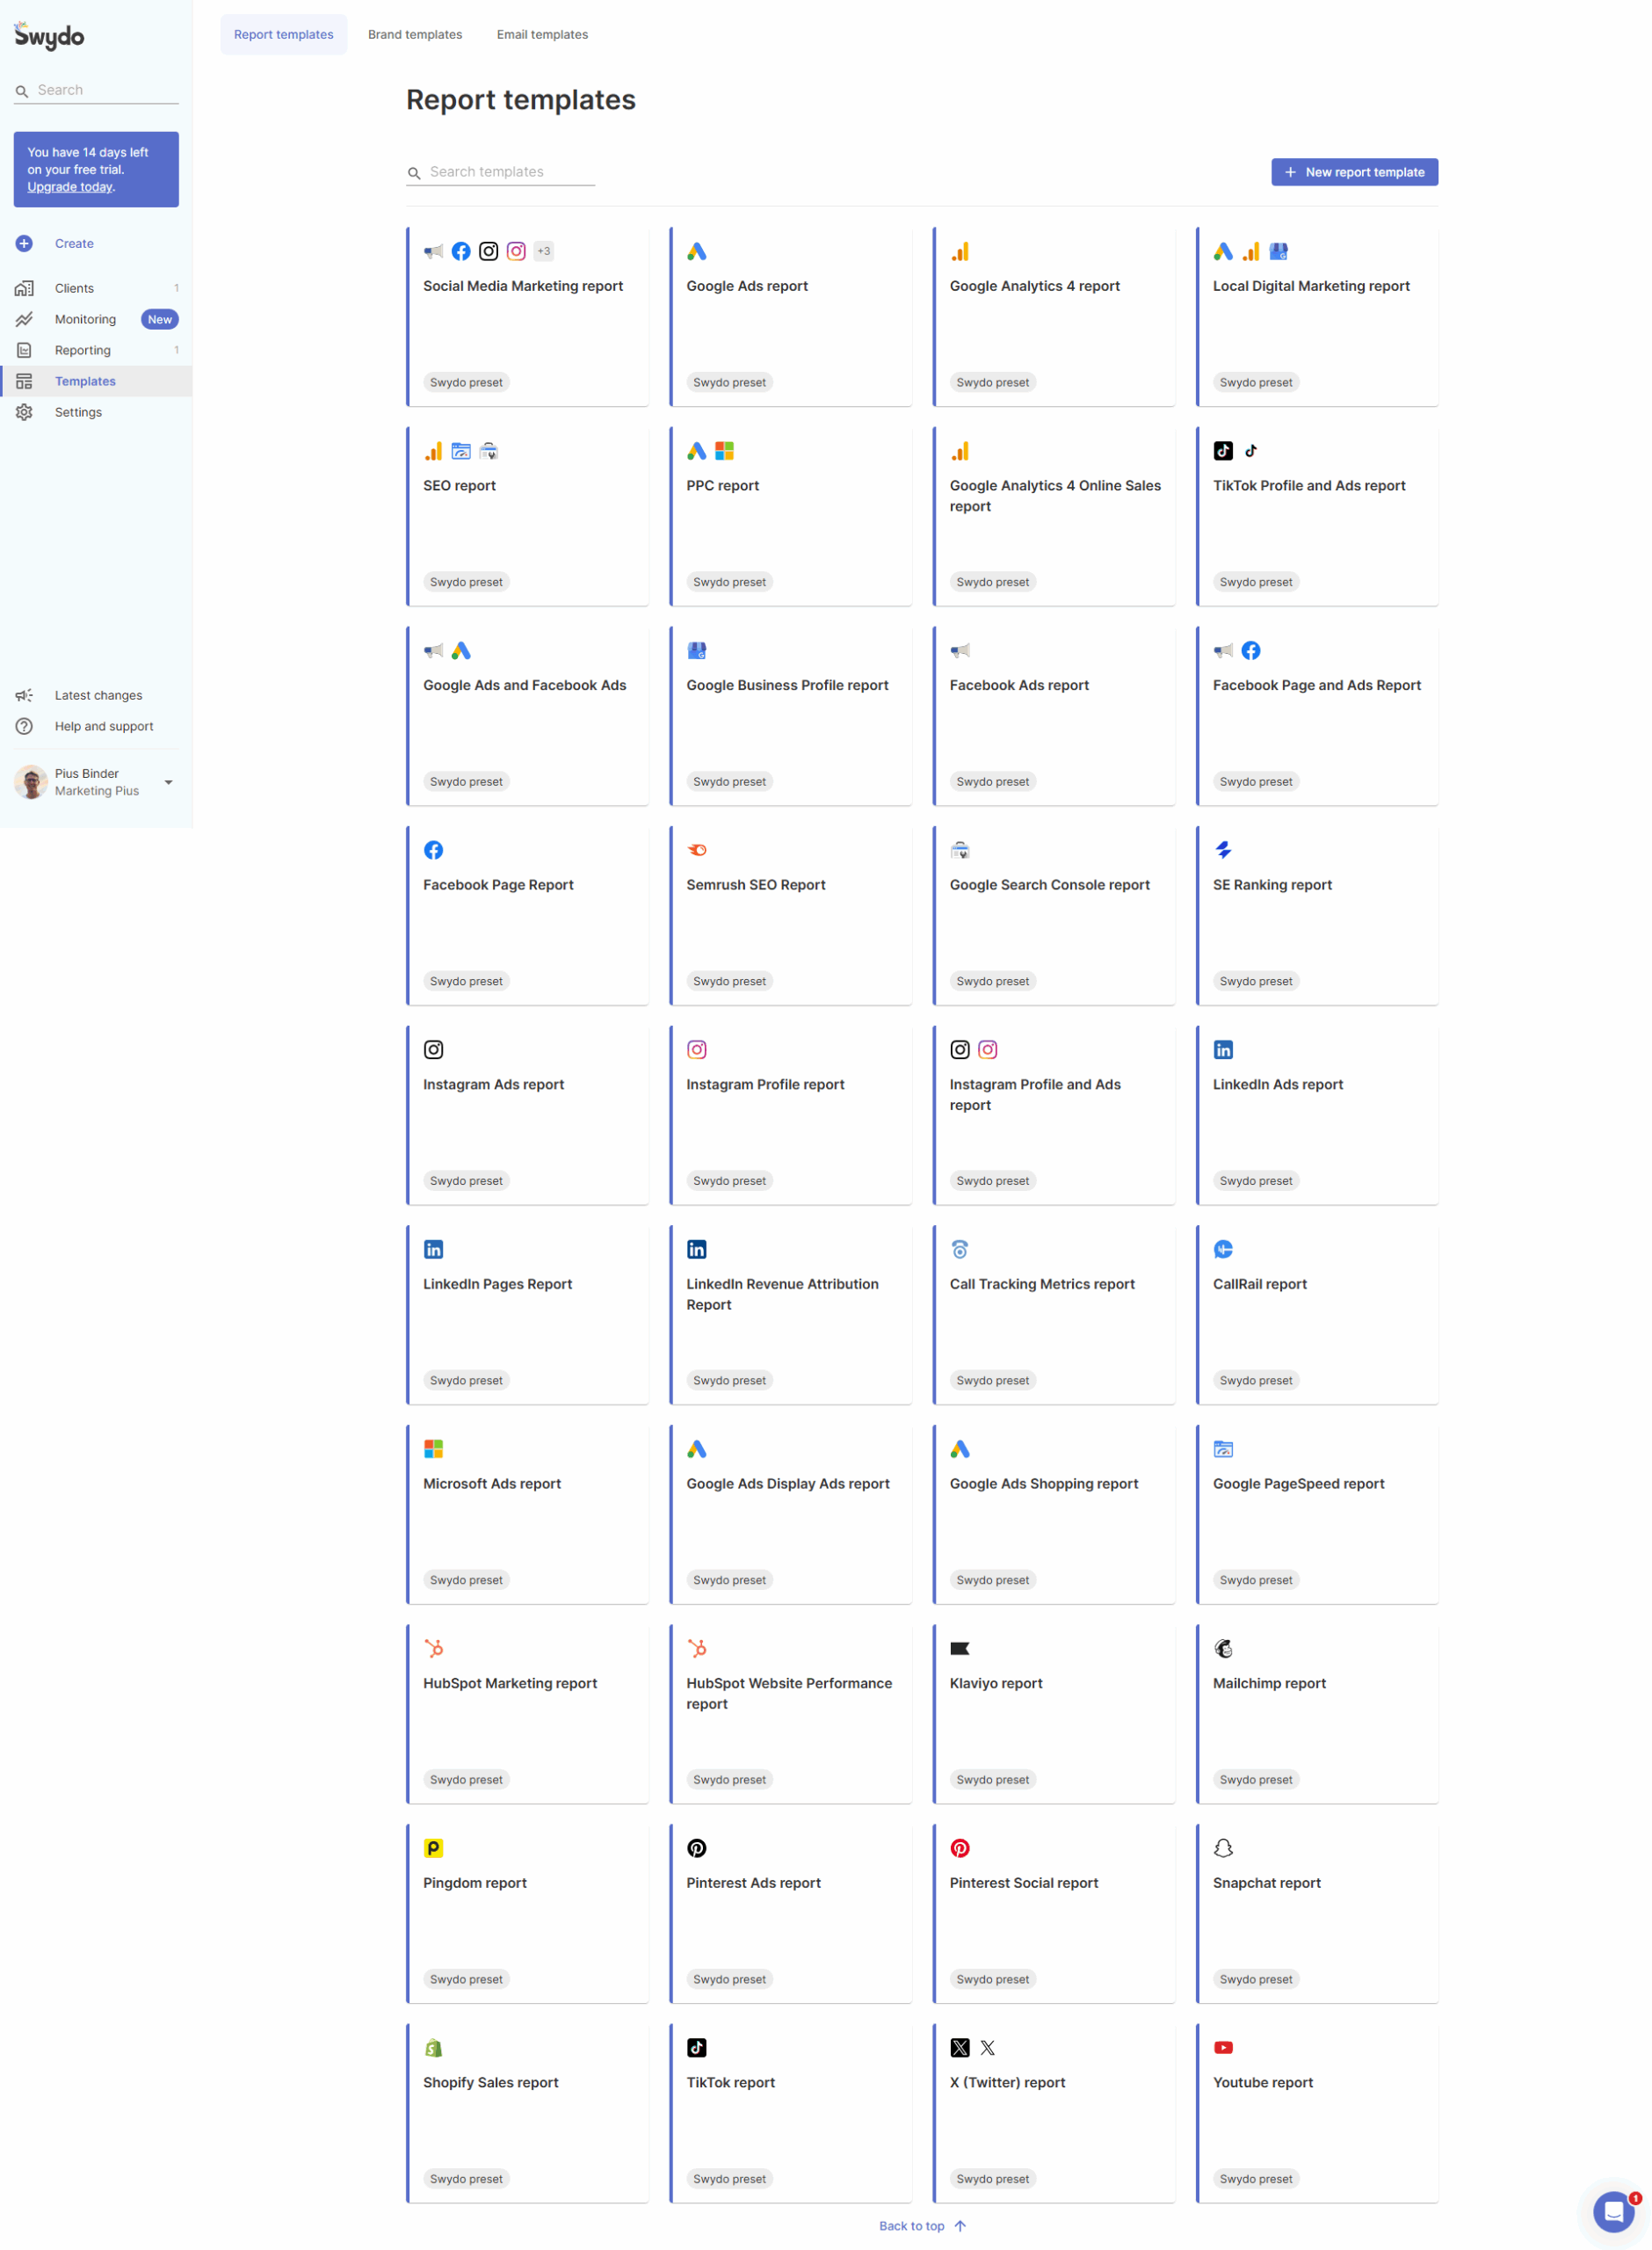
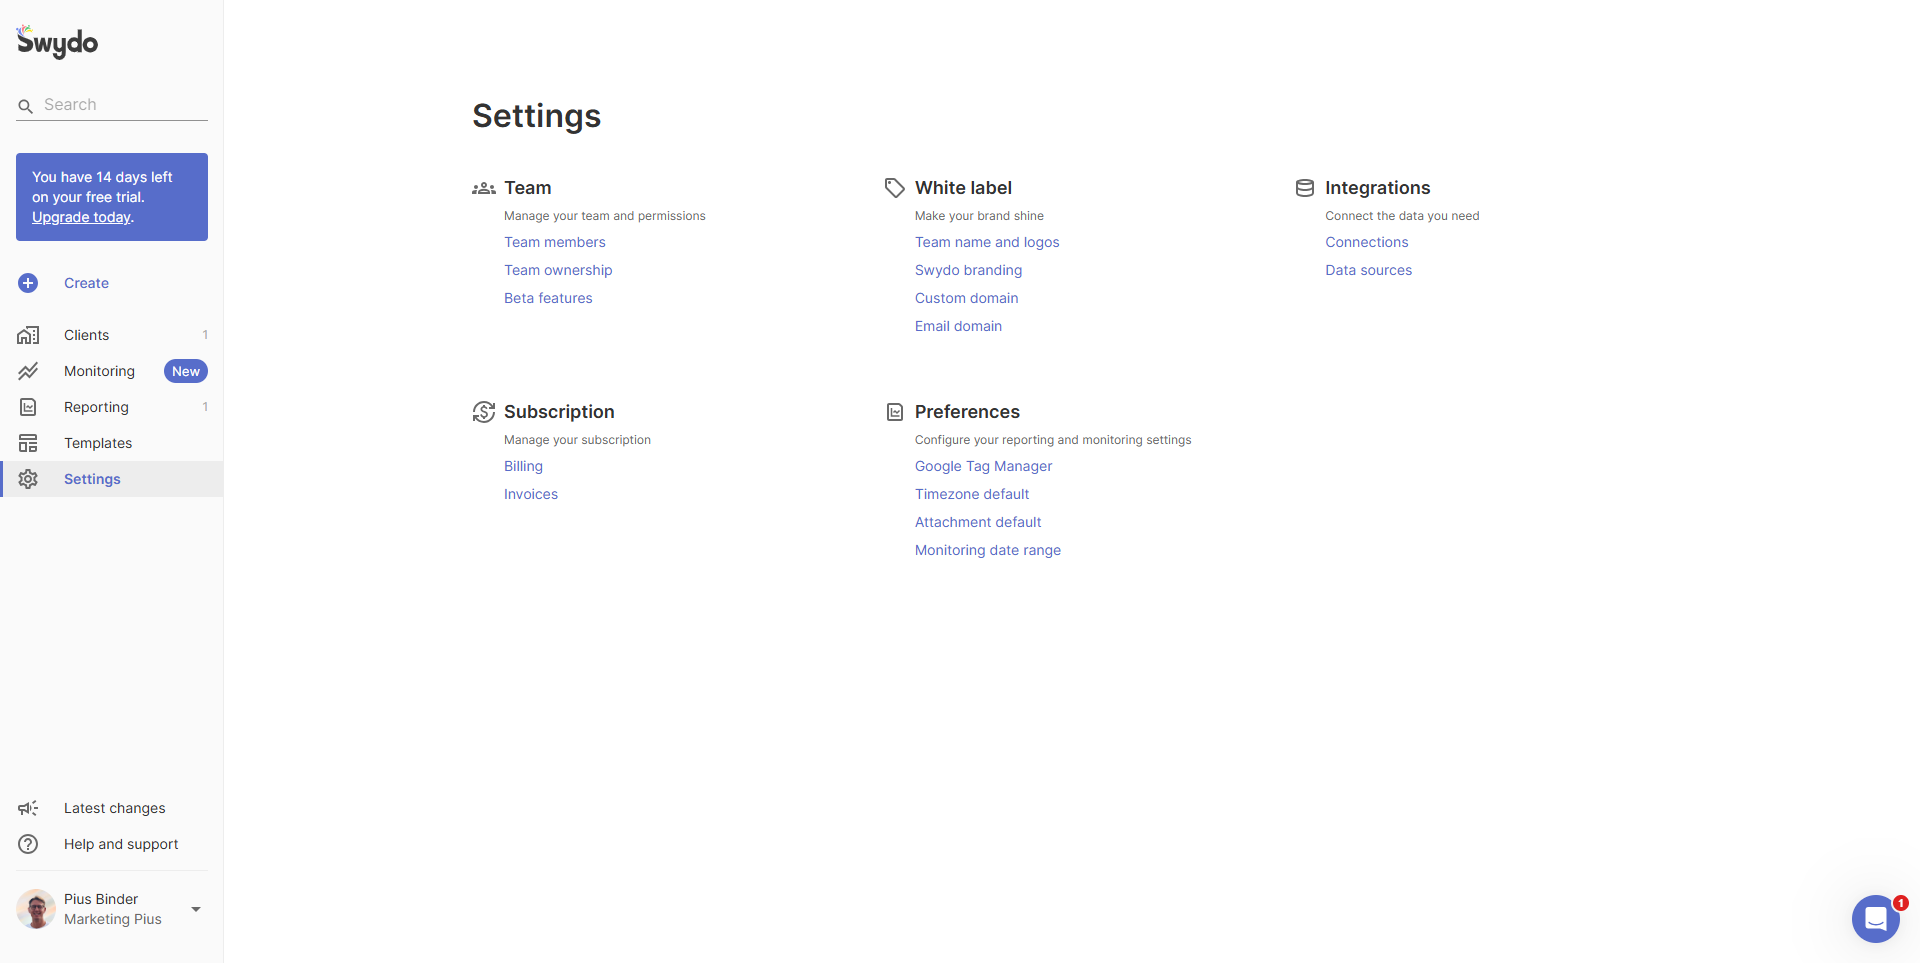
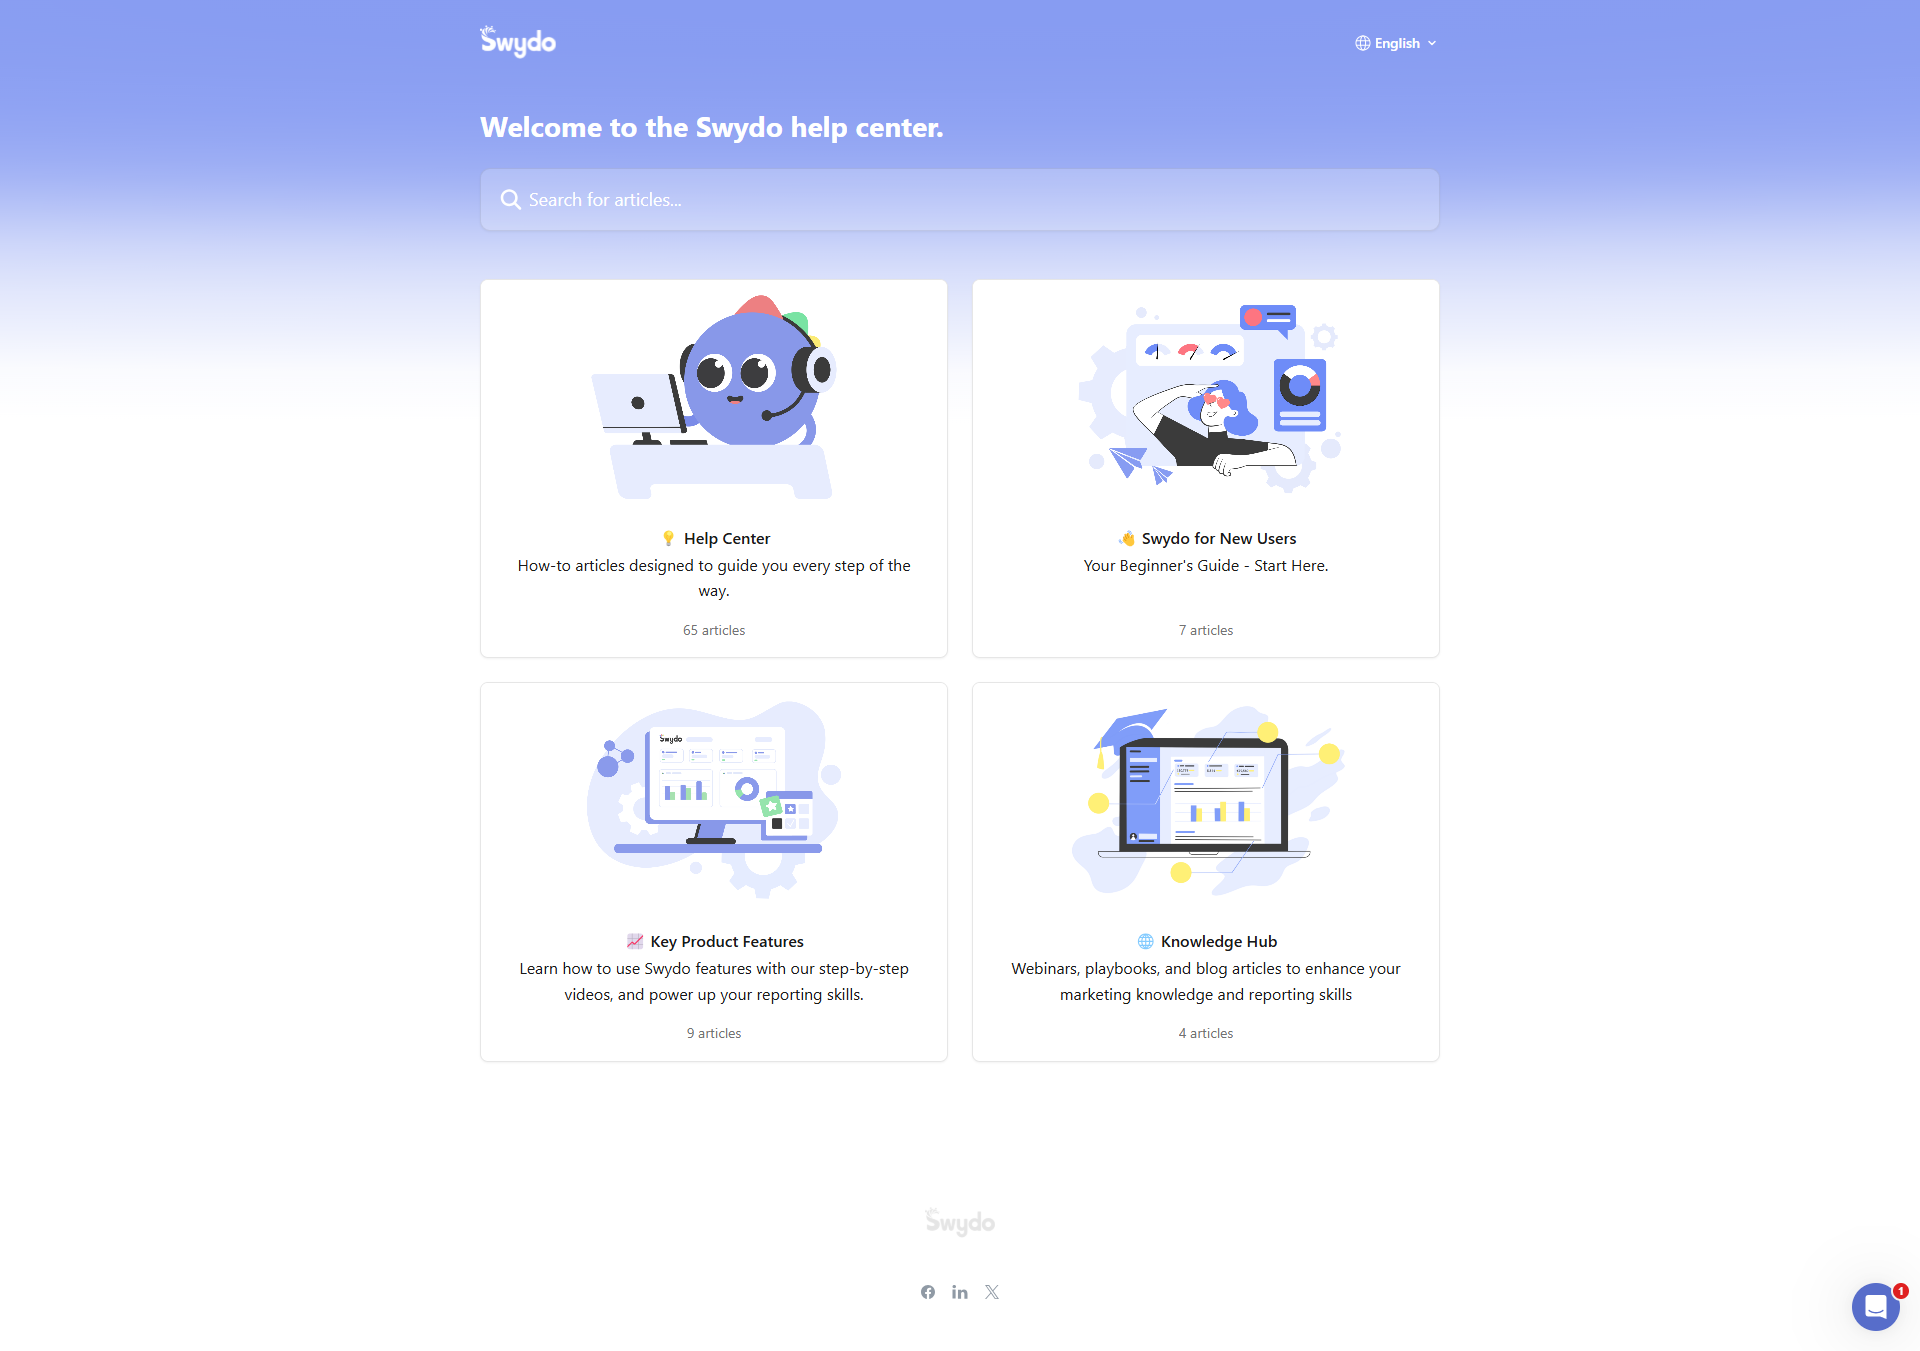
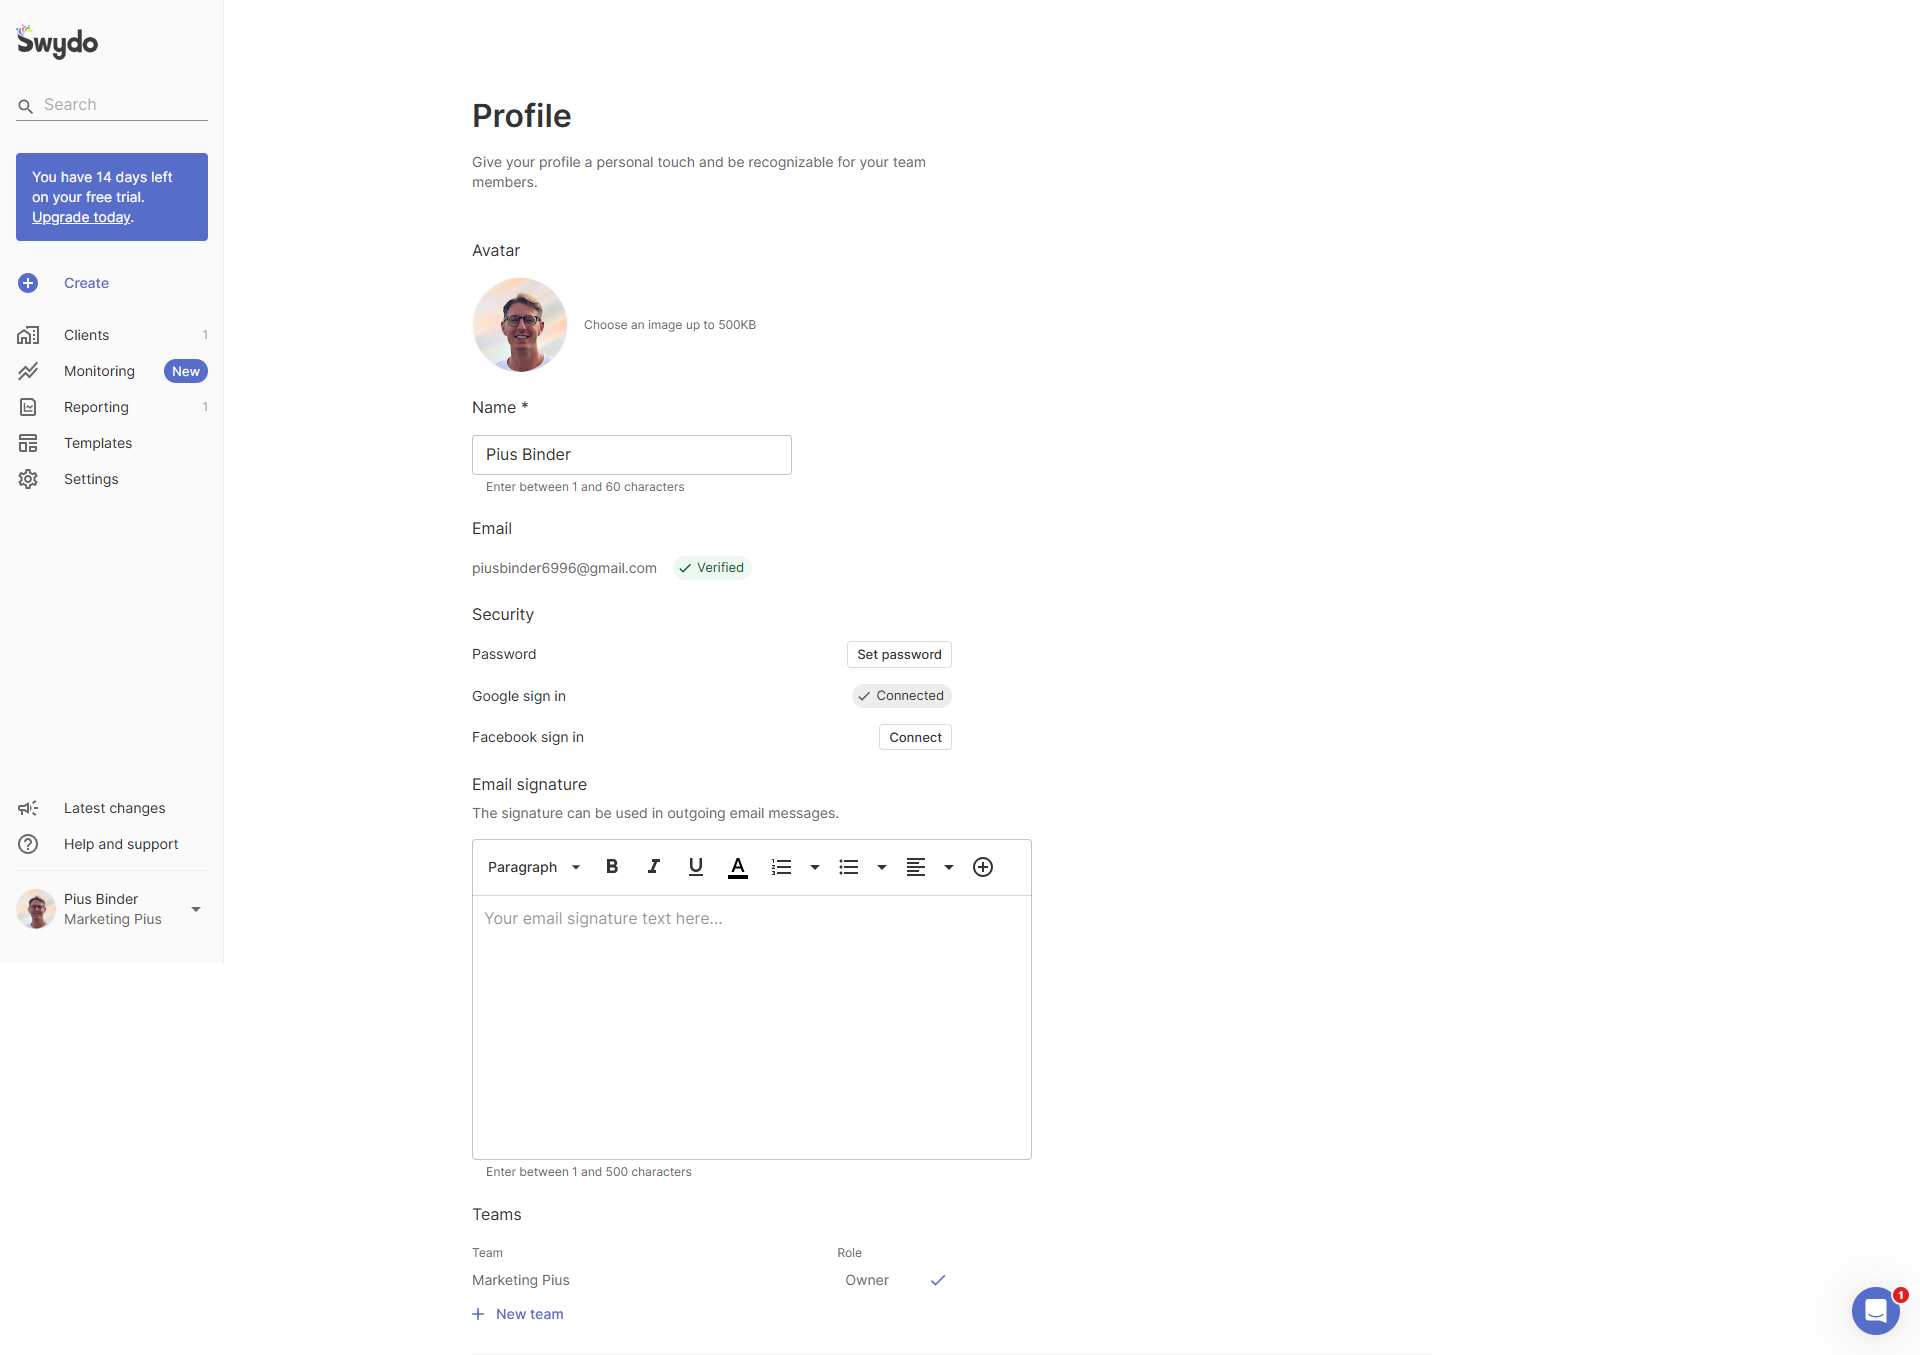
Swydo is a user-friendly reporting and monitoring platform designed for digital marketers and agencies. It offers customizable, automated reports and dashboards by integrating data from 34+ sources like Google Ads, Facebook Ads, and Google Analytics. The platform streamlines reporting processes, providing valuable insights to optimize marketing campaigns and enhance ROI. Time-saving and highly customizable, Swydo simplifies client reporting with a professional appearance.
Wink Reports simplifies complex reporting with an intuitive platform that connects seamlessly to your favorite cloud business apps. Build custom dashboards, automate tasks, and generate insightful reports to streamline business decision-making. With advanced customization and scheduling options, it’s perfect for teams of all sizes to access actionable data effortlessly.
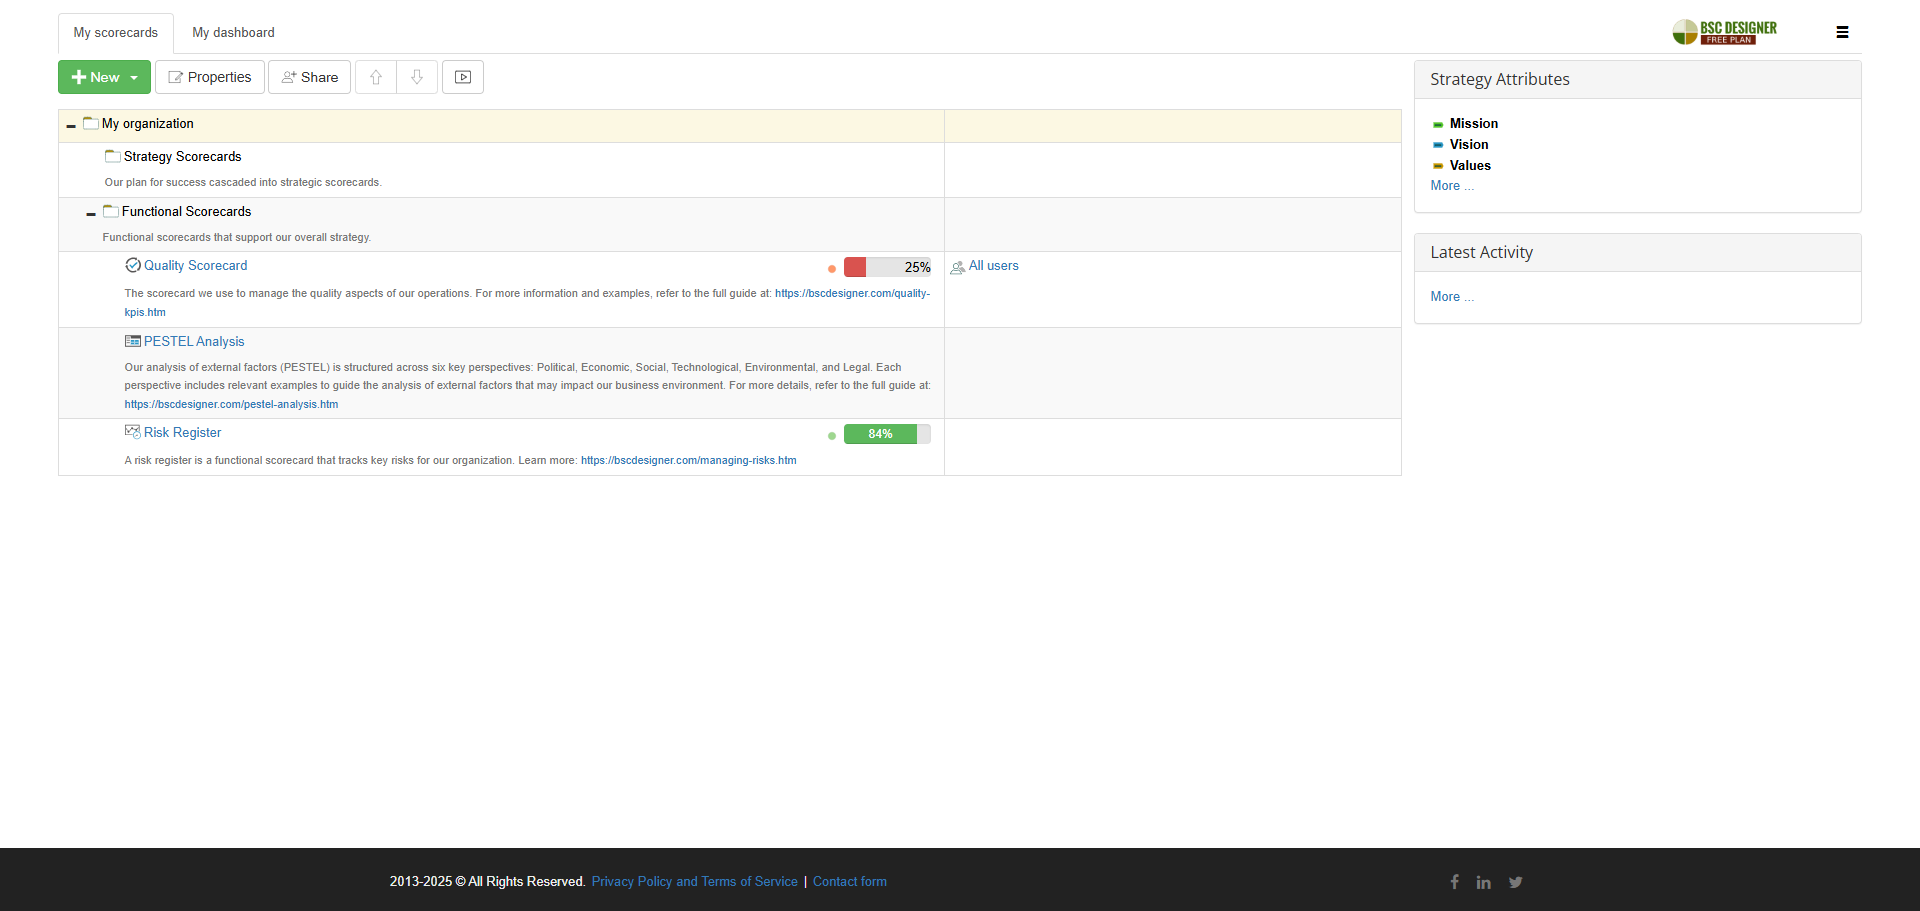
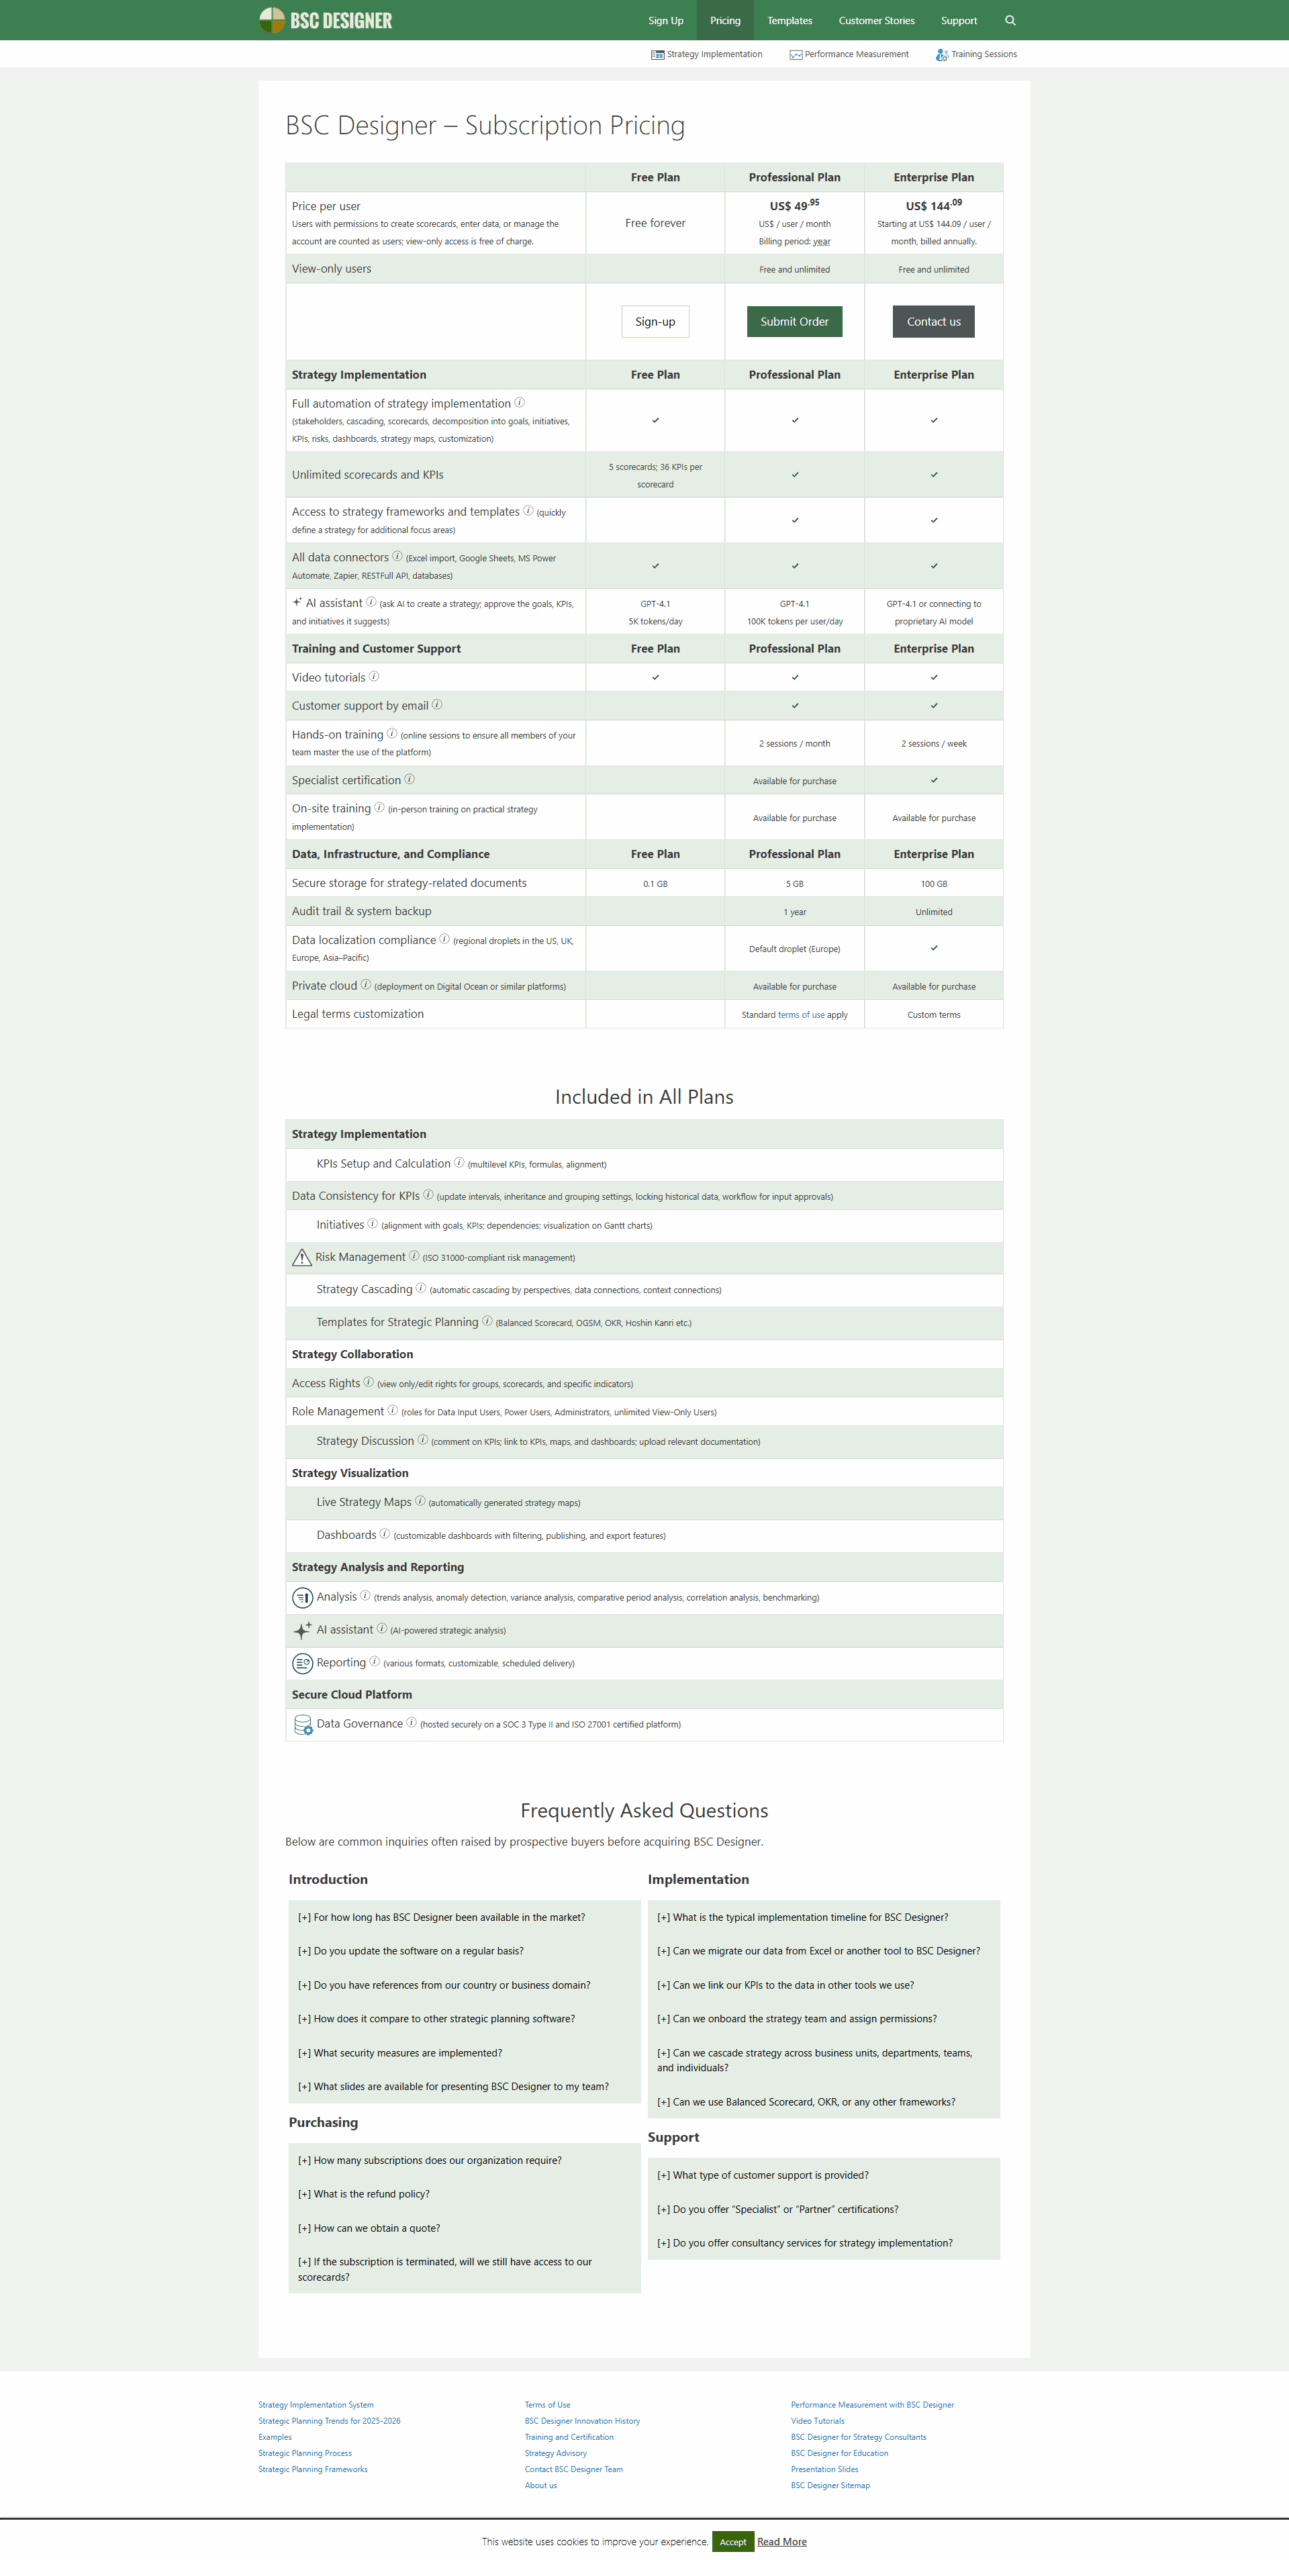
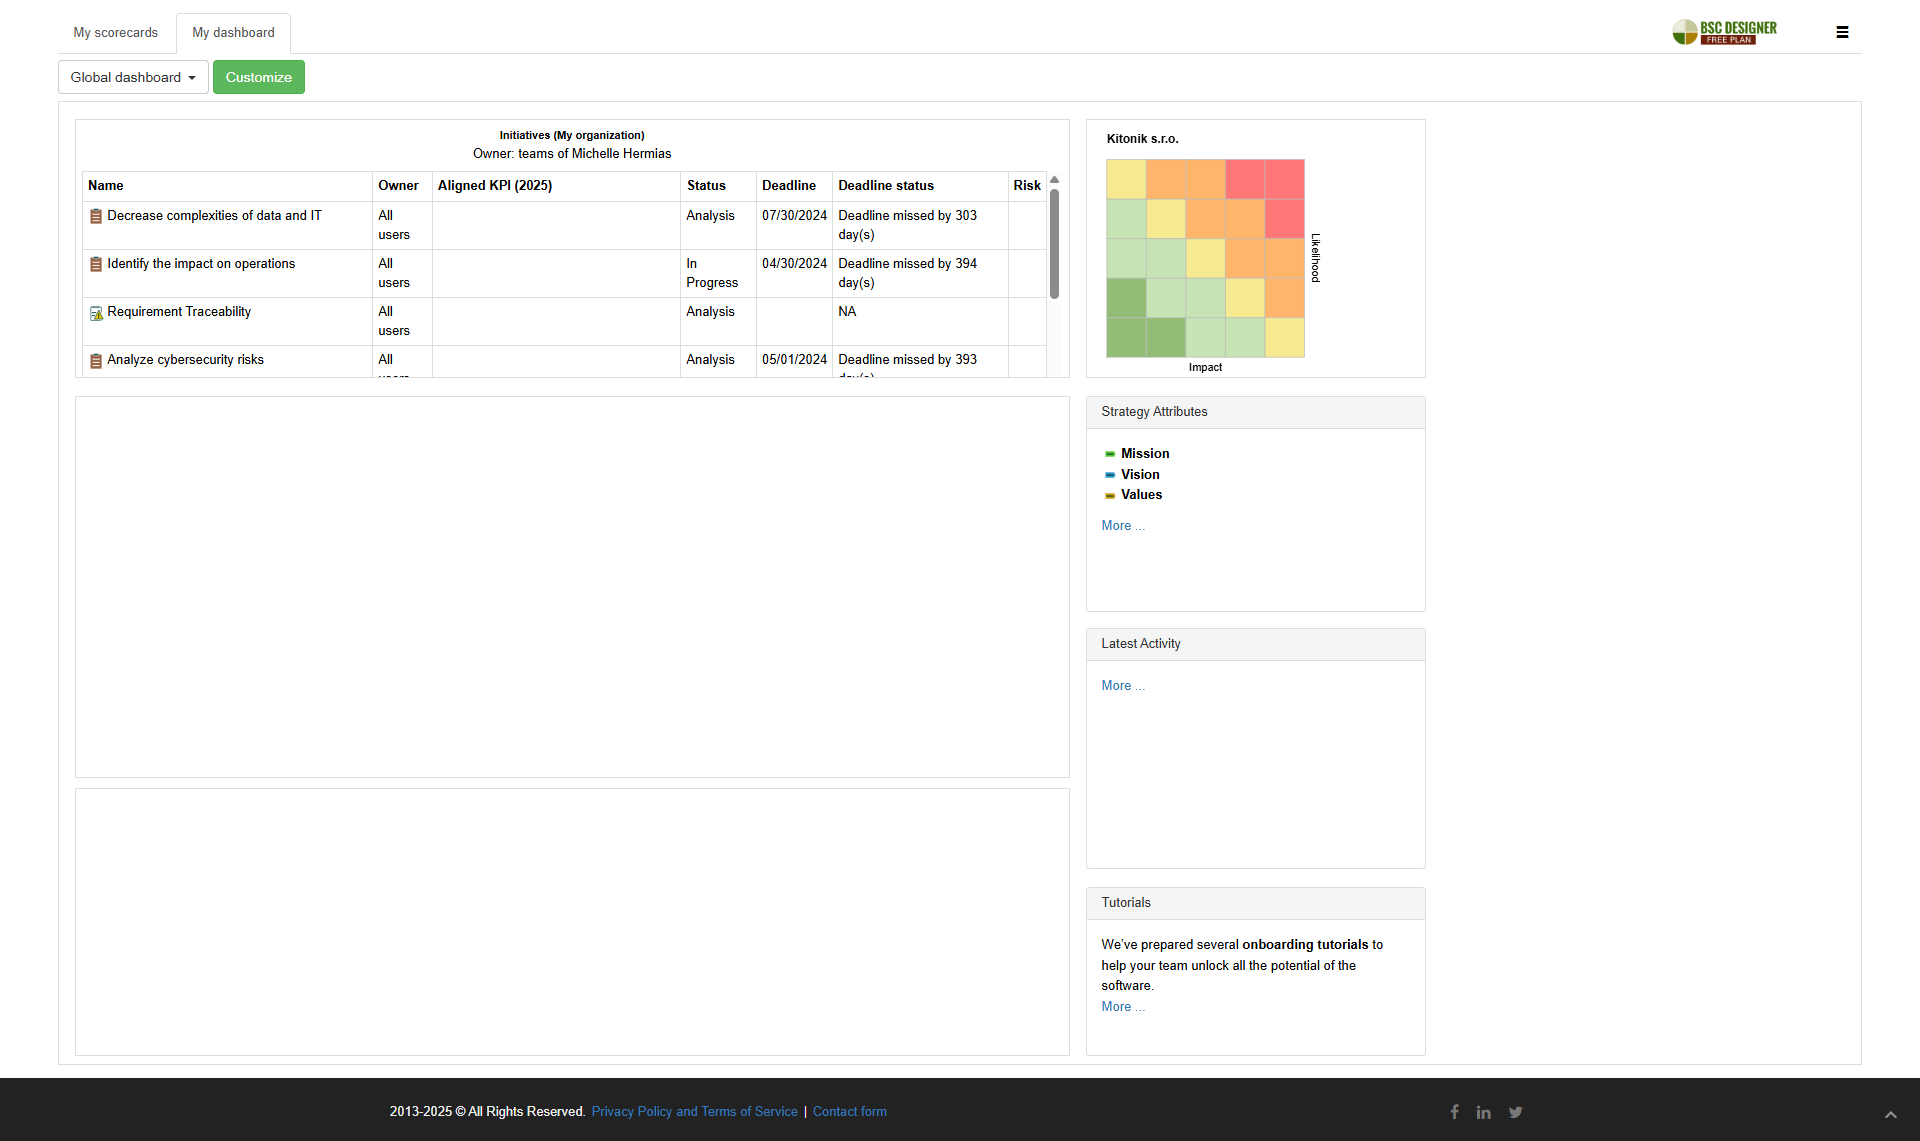
Scoreboard simplifies KPI management by linking strategic goals to business objectives, metrics, and initiatives. Its intuitive drag-and-drop interface enables users to create dynamic dashboards in minutes, updated automatically with real-time data. With powerful reporting and visualization tools, Scoreboard streamlines management reporting, eliminating the need for manual presentations. Ideal for businesses aiming for seamless strategic planning and performance tracking.
Reporting and Visualization software are powerful tools designed to transform raw data into meaningful, graphical representations. These solutions enable users to create, analyze, and share reports, facilitating better decision-making and insights. The primary purpose of Reporting and Visualization software is to simplify complex data sets, illustrate trends, patterns, and correlations, and provide actionable insights. Key functionalities include data integration, customizable charts and graphs, real-time updates, and interactive elements for exploration.
Reporting and Visualization software is widely applied across various industries, including marketing, finance, healthcare, and more. These tools help organizations address common business challenges such as data overload, poor decision-making, and lack of transparency. By providing clear and intuitive visualizations, Reporting and Visualization solutions enhance data analysis, improve communication among stakeholders, and support strategic planning. The benefits include enhanced data-driven decision-making, improved operational efficiency, and better performance tracking. These tools are essential for businesses of all sizes, from small startups to large enterprises, as they help in aggregating and summarizing key performance data, making it easier to understand and act upon.
Reporting and Visualization software is utilized by a diverse range of businesses and professionals. Small businesses use these tools to track key performance indicators (KPIs) and make informed decisions. Medium-sized businesses leverage them to optimize operations and improve customer insights. Large enterprises employ these solutions for comprehensive data analysis, predictive analytics, and strategic planning. Industry-specific roles such as marketing analysts, financial analysts, product managers, and data scientists also rely heavily on Reporting and Visualization tools to create detailed reports, analyze trends, and communicate findings effectively.
The key elements of Reporting and Visualization software include easy-to-use reporting features, the ability to handle multiple data sources, adaptable dashboards, and robust integration options. These tools offer customizable charts and graphs, real-time data updates, and interactive elements for data exploration. Other important features include data transformation and cleansing capabilities, predictive analytics, and advanced visualization options such as maps, gauges, and scorecards. Additionally, these tools often support collaboration and communication among team members, facilitating the sharing and analysis of reports. Integration with various data sources like databases, spreadsheets, and web pages is also a critical feature.