GraphPad Prism stands out as a premier statistical analysis and data visualization tool built specifically for scientific research. Trusted by a broad spectrum of users—from students to seasoned researchers—GraphPad Prism streamlines the process of analyzing data and producing publication-ready graphs that enhance scientific communication.
Designed with the needs of the life sciences community in mind, GraphPad Prism integrates advanced statistical methods with an intuitive interface. This seamless blend of power and ease-of-use makes it the preferred solution for those seeking to analyze experimental data and generate clear, aesthetically pleasing figures. The software’s capabilities allow researchers to tackle everything from basic statistical comparisons to more complex analytical tasks such as regression, ANOVA, and time series analysis.
Key Features and Advantages
- Robust Data Analysis: Perform rigorous statistical tests with tools that not only calculate significance but also guide you in selecting the correct methods for your data.
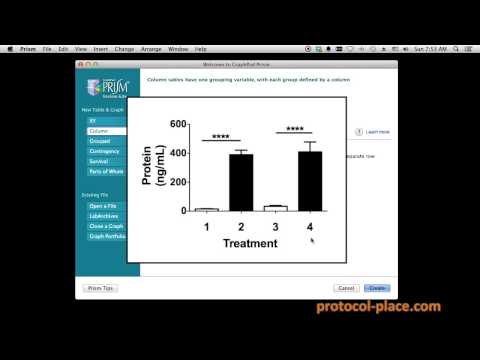
- Advanced Graphing Capabilities: Generate a wide variety of graphs and figures that can be easily customized. Whether dealing with grouped, XY, or any other graph types, the software offers a rich set of options ensuring consistency and clarity in your visuals.
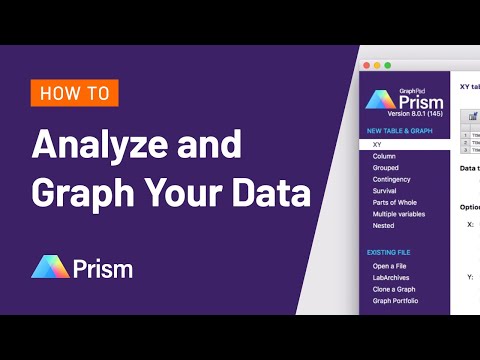
- User-Friendly Design: Its intuitive data entry system resembles an Excel-like grid that simplifies importing data and conducting repeated analyses. Helpful tutorials and a guided statistical framework assist new users in mastering the software quickly.
- Collaboration and Administration Tools: Benefit from features such as quality control, efficient data sampling, and seamless collaboration across teams, ensuring that multiple users can share and work on data simultaneously.
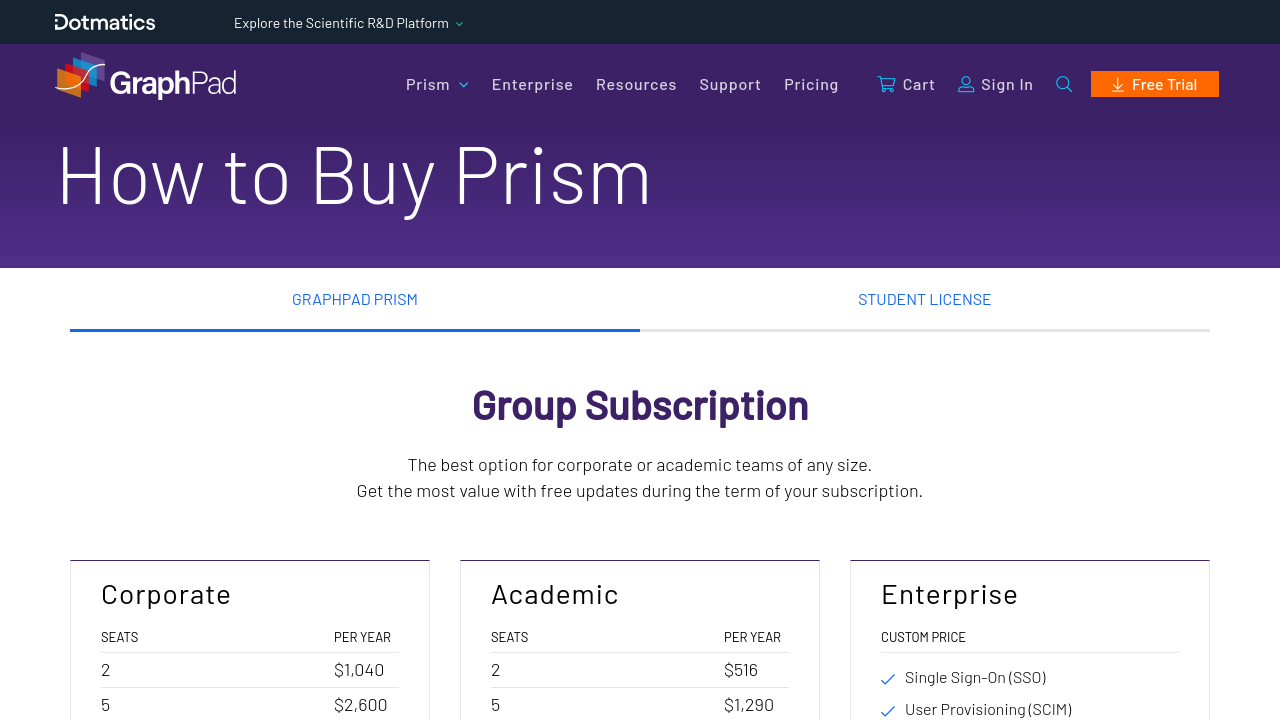
GraphPad Prism is ideally suited for scientists, researchers, educators, and students who demand precision and clarity in statistical analyses. Built by GraphPad Software in San Diego, California, the product’s long-standing heritage and commitment to innovation have made it a trusted partner in scientific inquiry since 1989.
Integration in the Statistical Analysis Ecosystem
Positioned within the Statistical Analysis category, GraphPad Prism offers comprehensive tools that ensure complex data is transformed into clear, decisive conclusions. Its flexibility and range of features reduce the learning curve for new users while delivering powerful analytics for advanced projects.
For an enhanced experience, exclusive deals are available at the GraphPad Prism deals page.
Alternatives to Consider
GraphPad Prism remains an invaluable tool that empowers researchers to perform comprehensive statistical analysis and produce high-quality correspondence ready for publication—all while simplifying the complex world of data analysis.