Enterprise Reporting and Visualization: Advanced Analytics for Large Businesses
Log in to leave your review.
Join our community of software reviewers on Subscribed.fyi

Continue With Google
Continue With LinkedIn
Continue Review with Email
Continue with Email
Enter your email to continue.
Continue
Enter your password
Enter your password to finish setting up your account.
Continue
Reset your password
Enter activation code we sent to your email.
Submit
Set your new password
Enter a new password for your account.
Submit
✨ Ask AI Search
Categories
For Business
Log in
Share Insight

Reporting and Visualization for Enterprise

For Enterprise businesses, navigating the complexities of data analysis and visualization can be a significant challenge. That's why our Reporting and Visualization products are specifically designed to address the unique needs of Enterprise companies. Our tailored solutions offer customized...

More Details

For Enterprise businesses, navigating the complexities of data analysis and visualization can be a significant challenge. That's why our Reporting and Visualization products are specifically designed to address the unique needs of Enterprise companies. Our tailored solutions offer customized analytics tools that streamline your analytics processes, ensuring ease of use and precision in tracking content performance.

Whether you are a small, medium, or enterprise-level Enterprise business, our Reporting and Visualization software is crafted to meet your distinct requirements. With features such as intuitive setup processes, flexible pricing models, and advanced visualization capabilities, you can make data-driven decisions with confidence. Our tools enable you to uncover trends, identify patterns, and optimize your strategies in real-time, enhancing your overall business performance.

By leveraging our Enterprise business solutions, you can transform complex data into actionable insights, driving growth and efficiency. Discover how our Reporting and Visualization products can help you achieve a deeper understanding of your customer behavior, improve user experiences, and stay ahead in the competitive landscape. Explore our customized analytics tools today and experience the power of streamlined analytics tailored specifically for Enterprise companies.

Less Details

8 Products available in Reporting and Visualization for Enterprise

#1

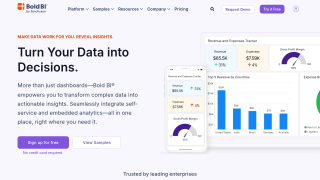
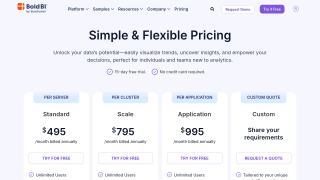
Bold BI by Syncfusion is a powerful analytics platform designed for seamless embedding into applications. It enables users to create interactive dashboards and gain actionable insights from over 150 data sources. With its modern architecture, user-friendly tools, and robust customization options, Bold BI empowers developers, analysts, and businesses across industries. Its flexible deployment and advanced features ensure accessible and secure analytics anywhere.

Pros and Cons
User-friendly drag-and-drop widgets
Complex to use for beginners
Top 3 Alternatives
Pricing Range
Not specified
Bold BI 15-Day Free Trial: Unlock Business Insights
15-Day Free Trial
#2

GoodData is an end-to-end analytics platform designed to transform raw data into actionable insights. It offers robust features like data integration, modeling, visualization, AI-driven analytics, and interactive dashboards, accessible through code or a no-code interface. With its scalable, API-first approach, GoodData supports seamless deployment across various environments, empowering organizations to make data-driven decisions. Trusted by over 140,000 businesses, it enables the creation of customized analytics solutions for both technical teams and end-users.

Pros and Cons
User-friendly and intuitive interface
Steep learning curve for beginners
Top 3 Alternatives
Pricing Range
$20/Month
GoodData 30-Day Free Trial: Unlock Advanced Analytics Capabilities
30-Day Free Trial
#3

Power My Analytics is a reporting automation tool designed for digital marketers to seamlessly collect and integrate data from advertising, social media, email, shopping, and CRM platforms. It consolidates metrics into destinations like spreadsheets, analytics tools, and SQL databases, ensuring streamlined workflows and data integrity. With user-friendly templates and robust connectors, it saves time and enhances decision-making while offering unmatched cost-effectiveness.

Pros and Cons
Easy to use with quick setup.
Limited templates for reporting.
Top 3 Alternatives
Pricing Range
Google Workspace Pricing: Not specified Power My Analytics Pricing: $14.95-$49.95/Month
Power My Analytics Annual Savings: Unlock 16% Off Your Subscription
16% Annual Plan Discount
#4

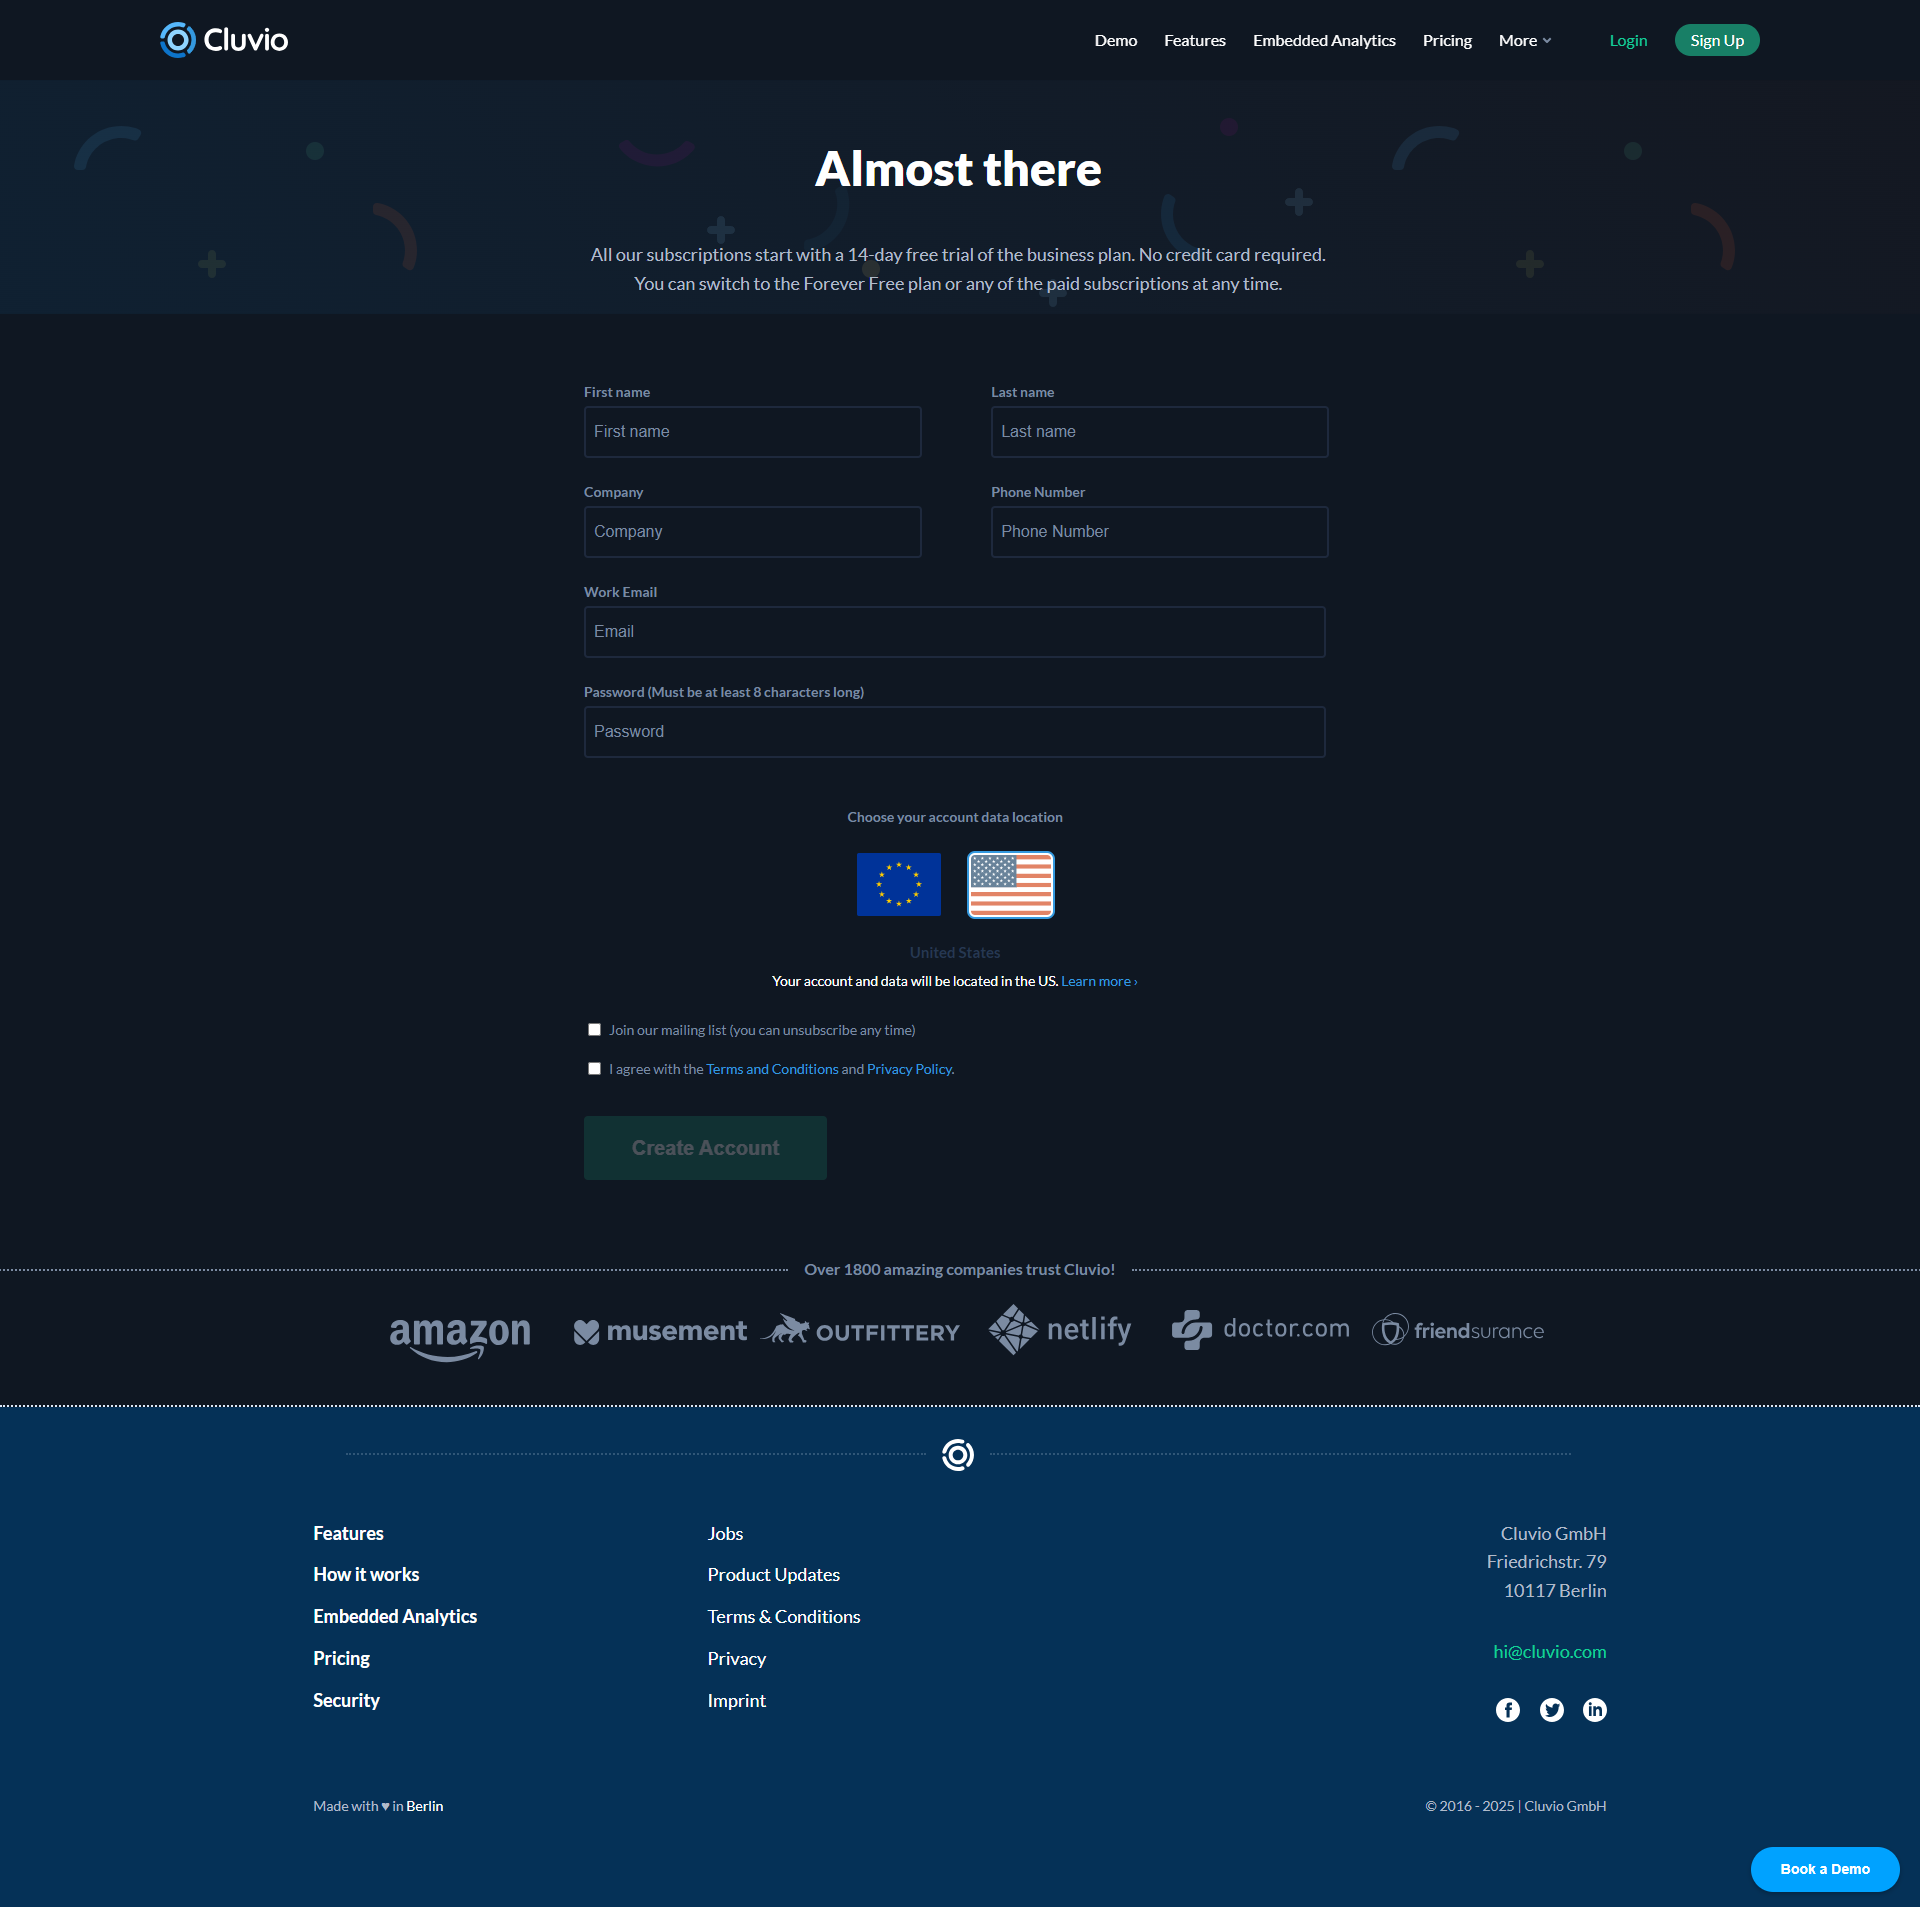
Cluvio is a user-friendly cloud analytics platform designed for startups and SMEs to quickly create visually appealing, SQL and R-based interactive dashboards. It enables seamless sharing of insights within teams or with customers and offers powerful embedding options for integrating analytics into web applications. With affordable pricing tiers and ease of use, Cluvio is perfect for businesses seeking efficient data visualization.

Pros and Cons
Quick and easy setup for dashboards.
Limited customization for dashboards and graphs.
Top 3 Alternatives
Pricing Range
$111-$669/Month
Cluvio Forever Free Plan: Unlock Data Insights for Free!
Forever Free Plan
#5

Geckoboard is a real-time dashboard tool designed to help teams display and share key metrics effortlessly. With a user-friendly drag-and-drop interface, it connects to over 90 tools like Google Analytics, Salesforce, and HubSpot to streamline data visualization. Ideal for office screens or remote sharing, it keeps teams aligned with live updates and customizable dashboards. Enhance clarity, engagement, and performance tracking with Geckoboard’s simple yet powerful features.

Pros and Cons
Easy to set up and use
Limited customization options
Top 3 Alternatives
Coming Soon!
Pricing Range
$44-699/Month
Geckoboard 14-Day Free Trial: Unlock Real-Time KPI Dashboards
14-Day Free Trial
#6

Looker, part of Google Cloud, is a powerful business intelligence platform designed for modern data analytics and visualization. It integrates data from diverse sources into a unified view, enabling teams to create interactive dashboards, share insights, and enhance decision-making. With a user-friendly interface, customizable visualizations, and a robust data modeling layer, Looker empowers organizations to harness the full potential of their data efficiently.

Pros and Cons
User-friendly interface for creating dashboards.
Performance issues with large datasets.
Top 3 Alternatives
Pricing Range
Not specified
Looker Custom Pricing: Tailor Your Analytics Solution
Customizable Pricing Plans
#7

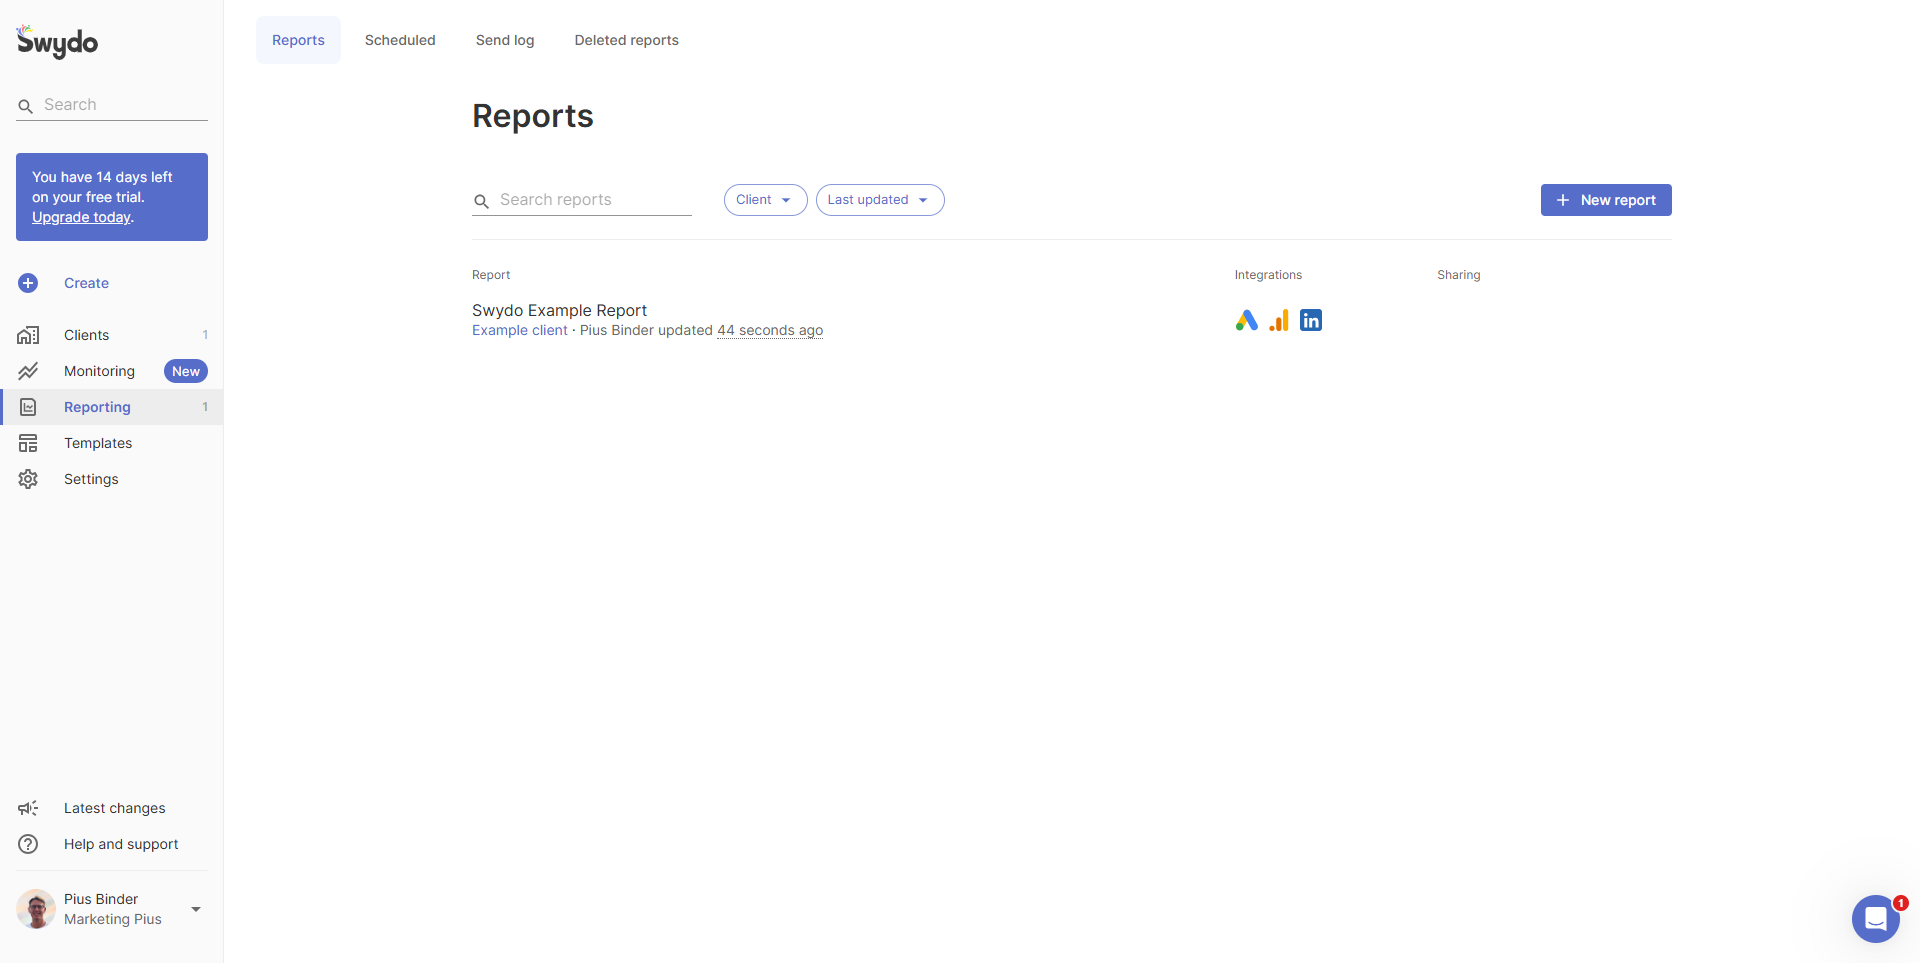
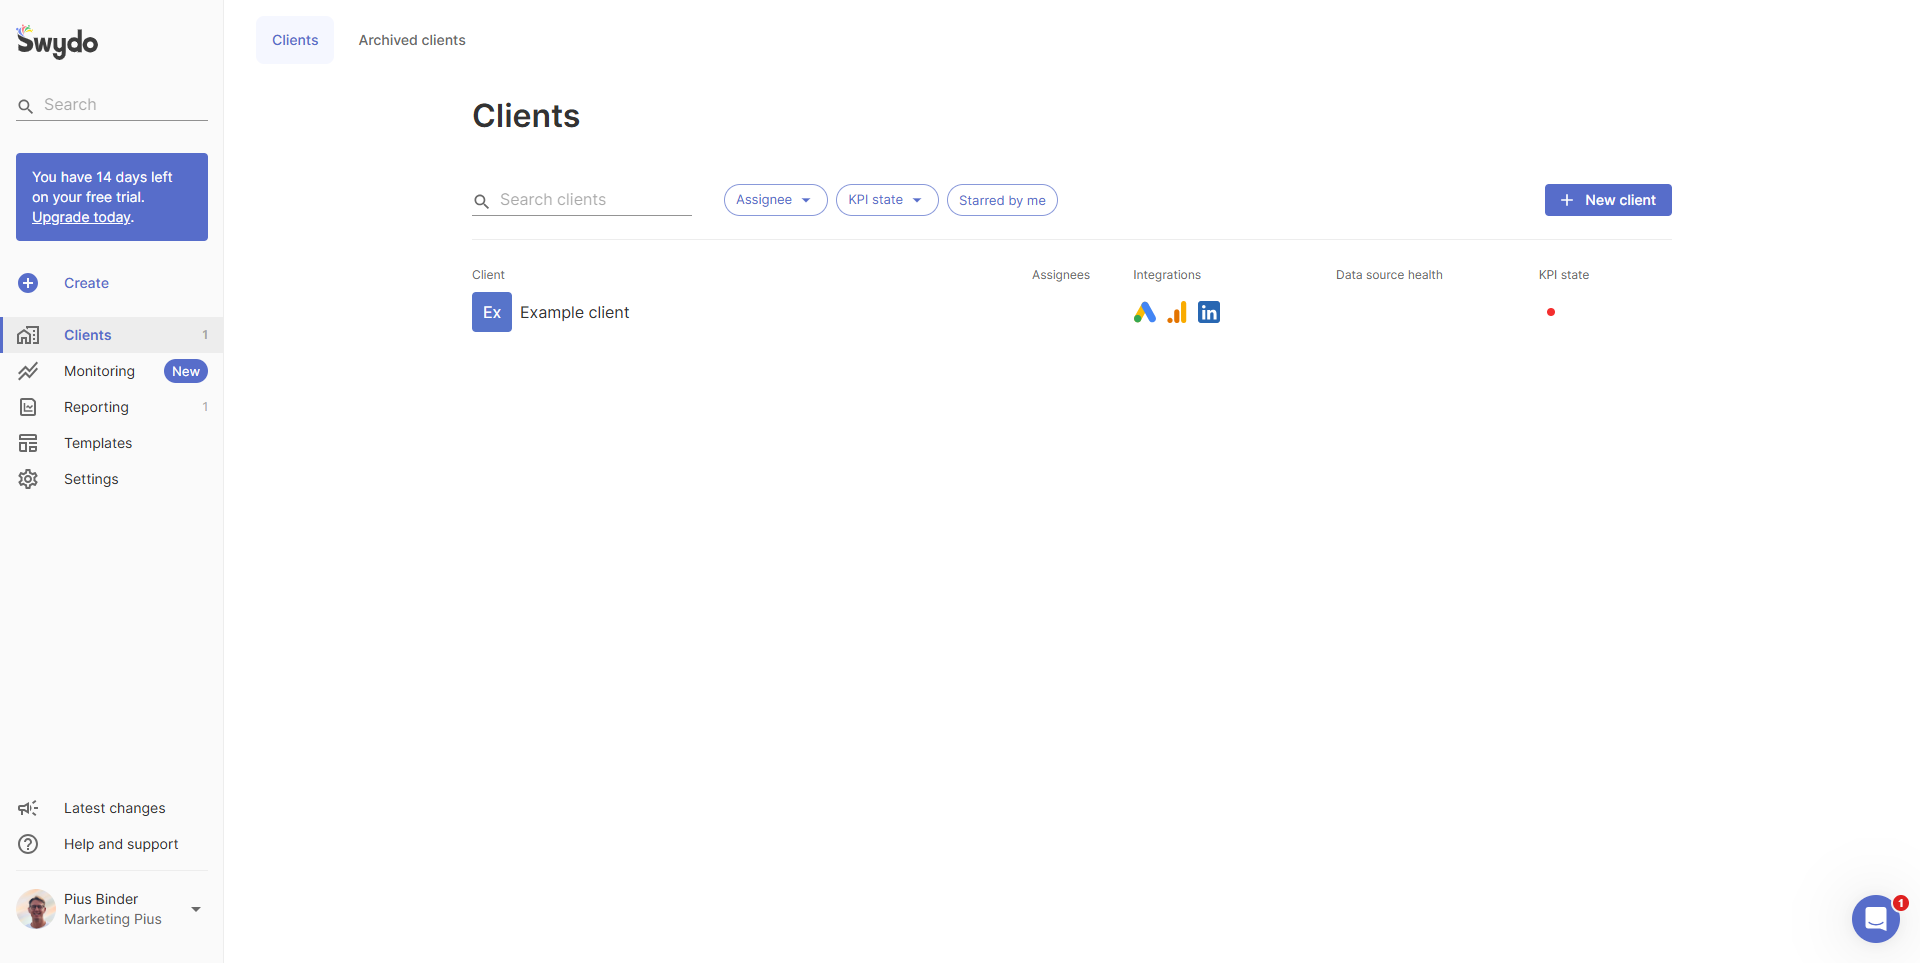
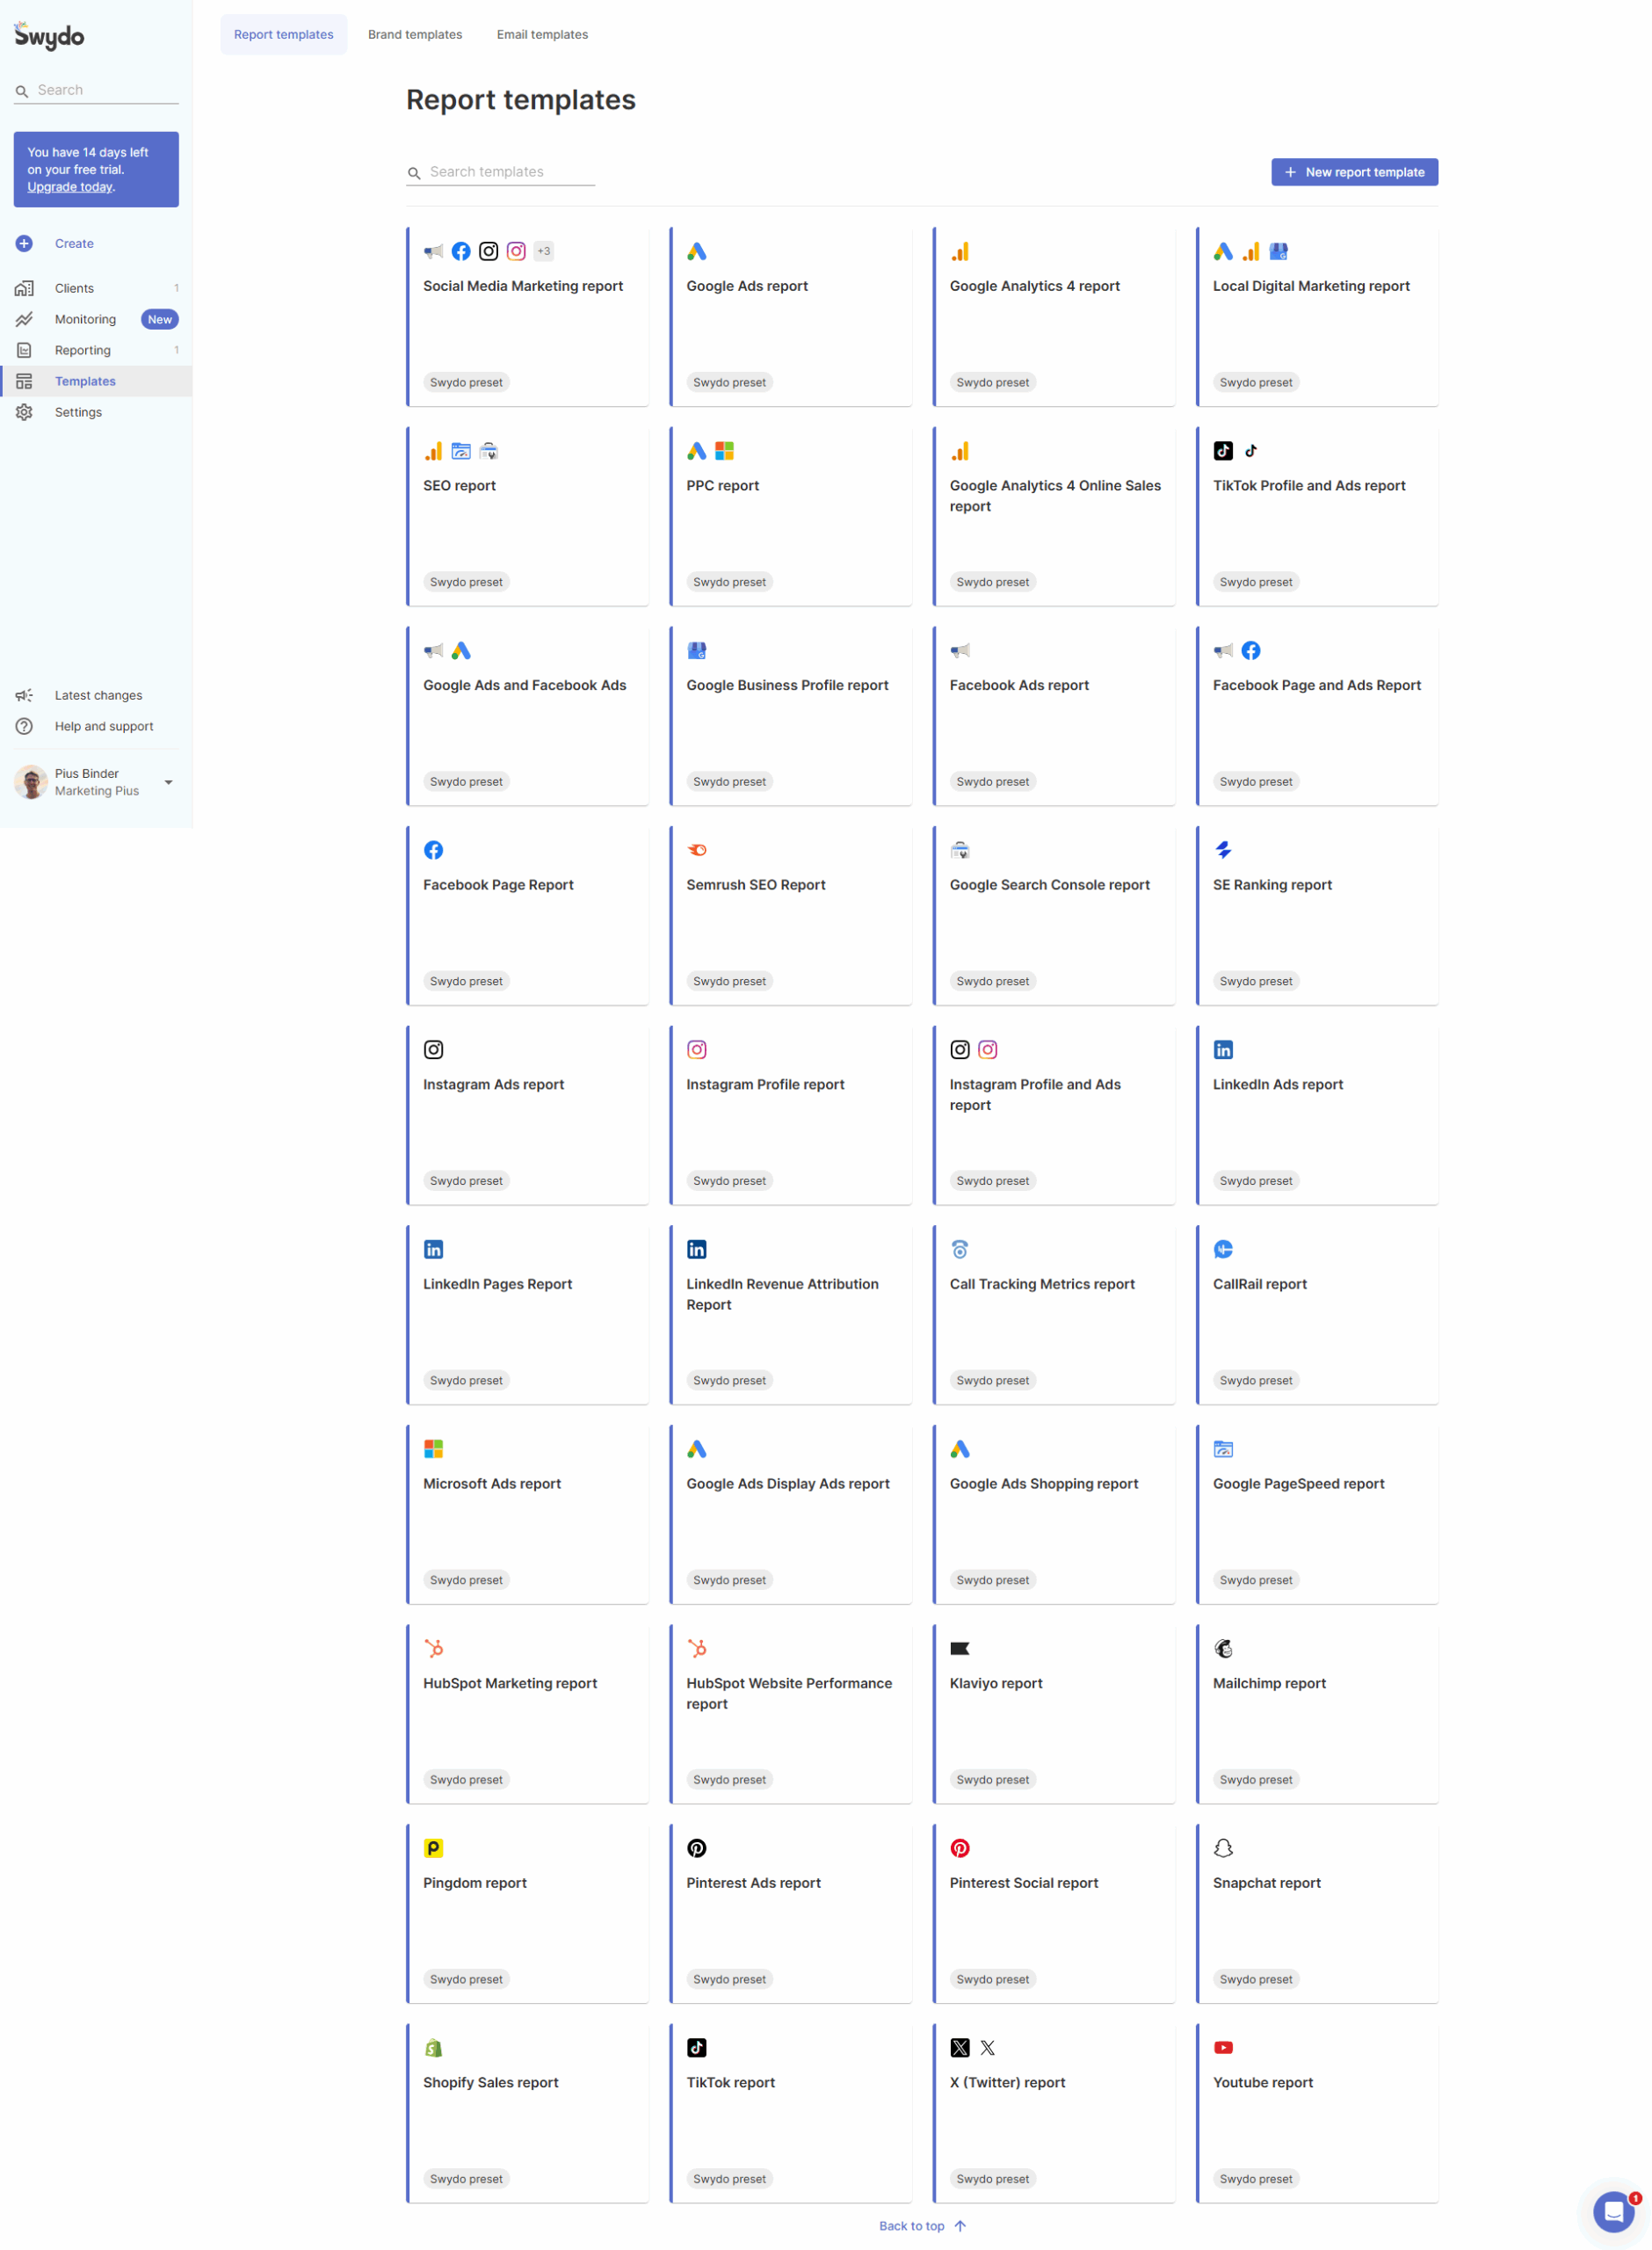
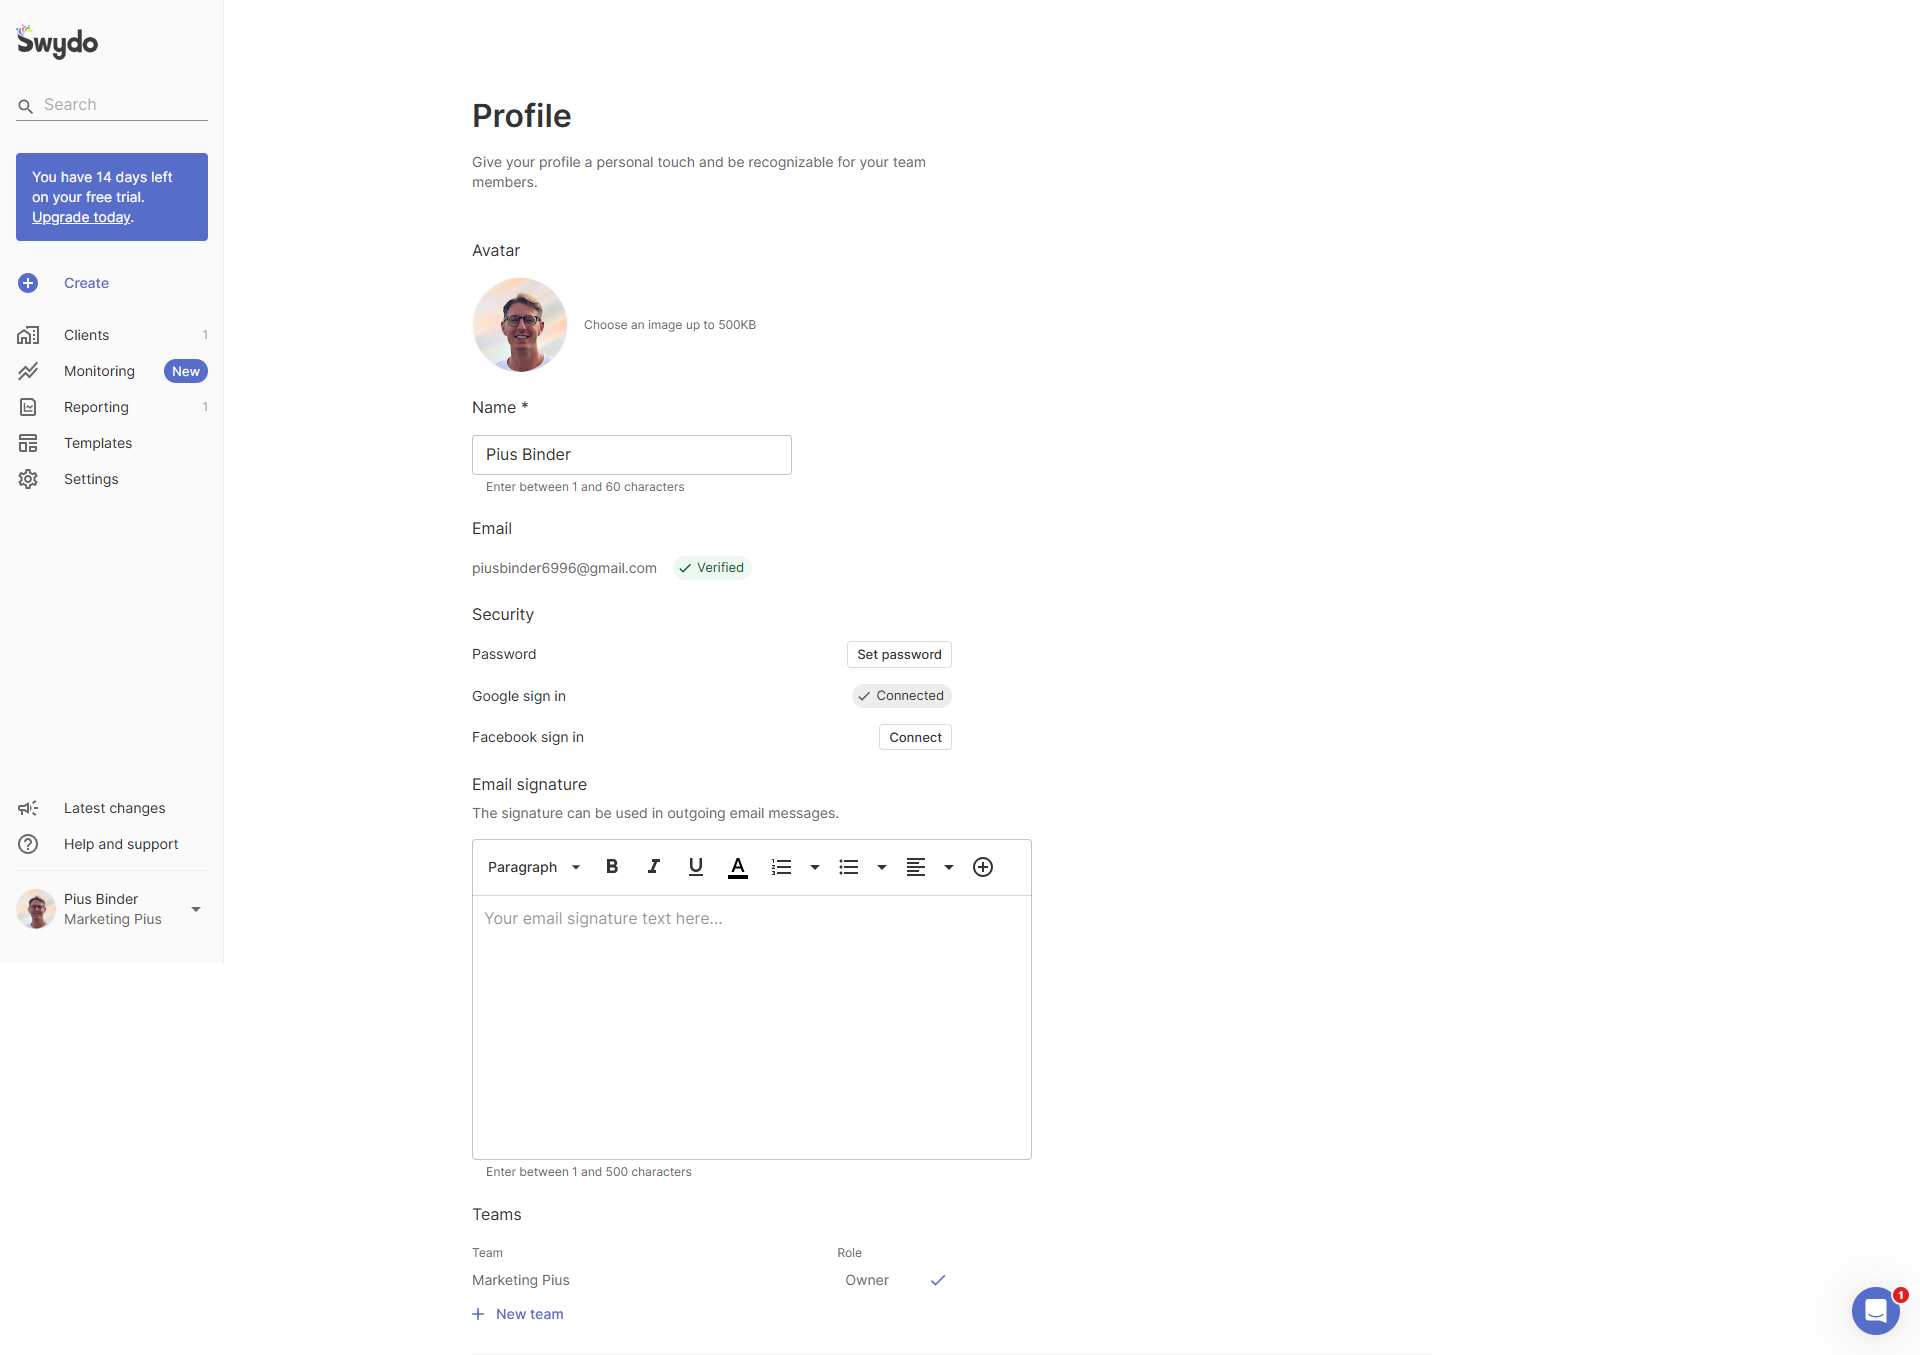
Swydo is a user-friendly reporting and monitoring platform designed for digital marketers and agencies. It offers customizable, automated reports and dashboards by integrating data from 34+ sources like Google Ads, Facebook Ads, and Google Analytics. The platform streamlines reporting processes, providing valuable insights to optimize marketing campaigns and enhance ROI. Time-saving and highly customizable, Swydo simplifies client reporting with a professional appearance.

Pros and Cons
Easy to use and customize reports
Limited design customization options
Top 3 Alternatives
Pricing Range
$49-1.5k/Month
Swydo Free Trial: Experience AI-Driven Reporting for 14 Days
14-Day Free Trial
#8

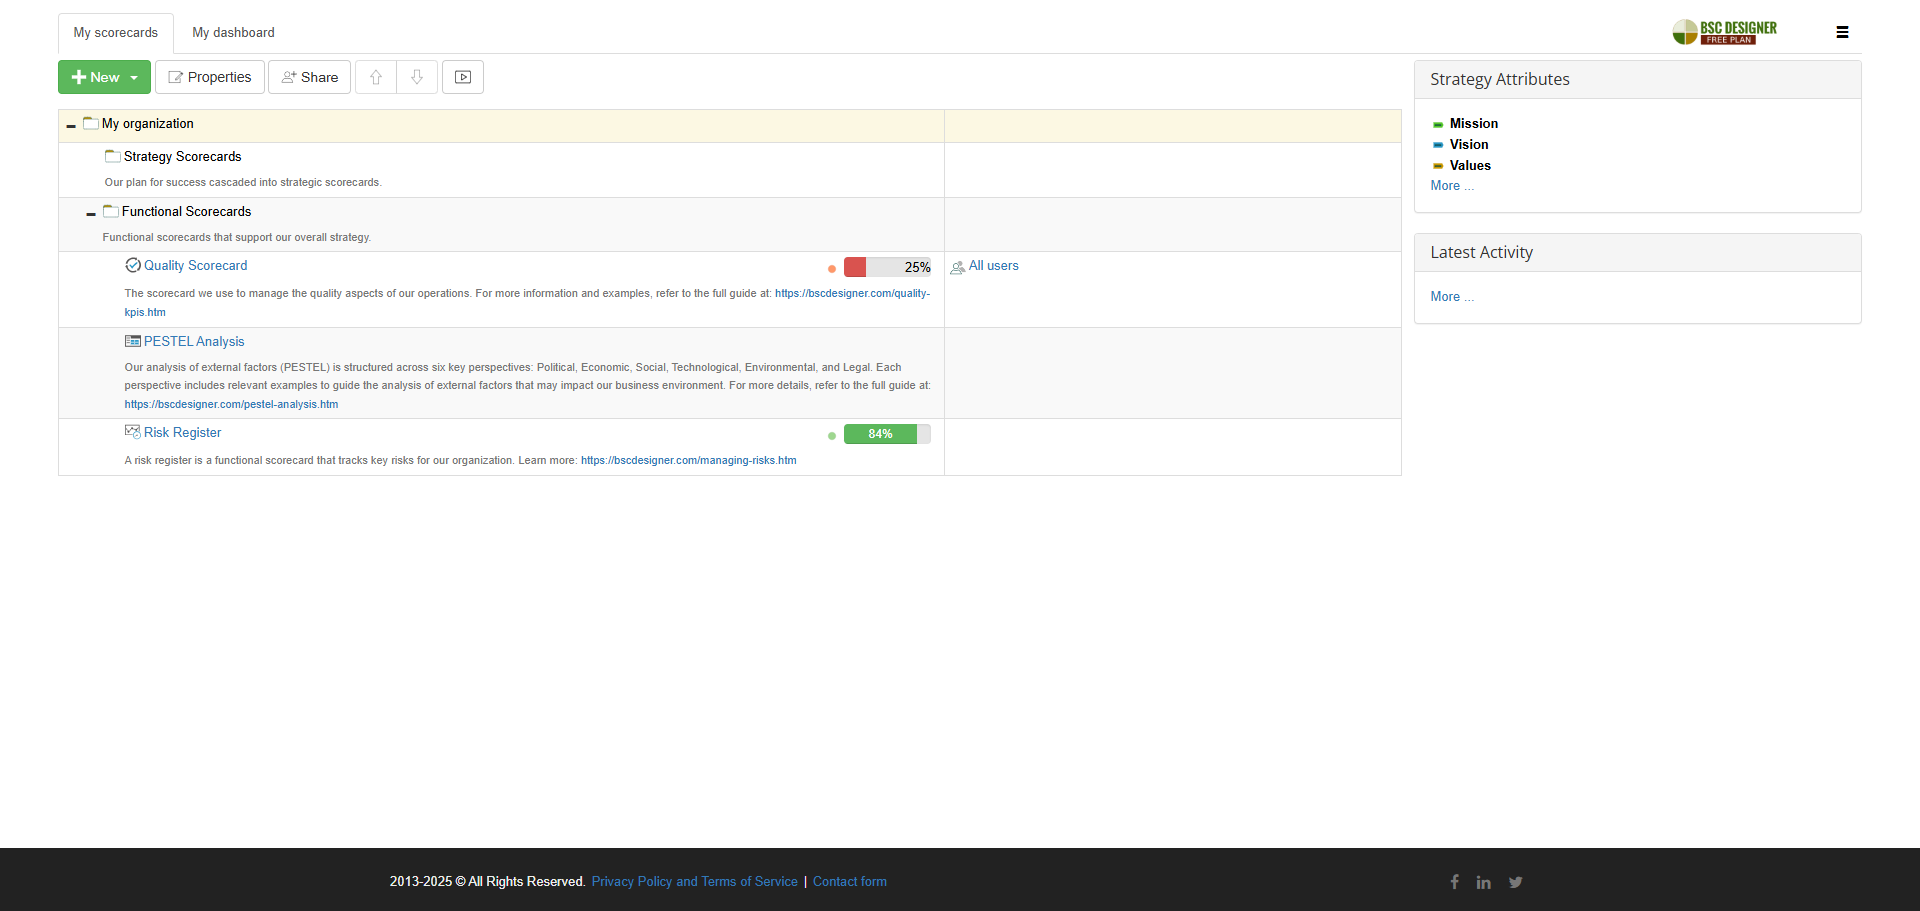
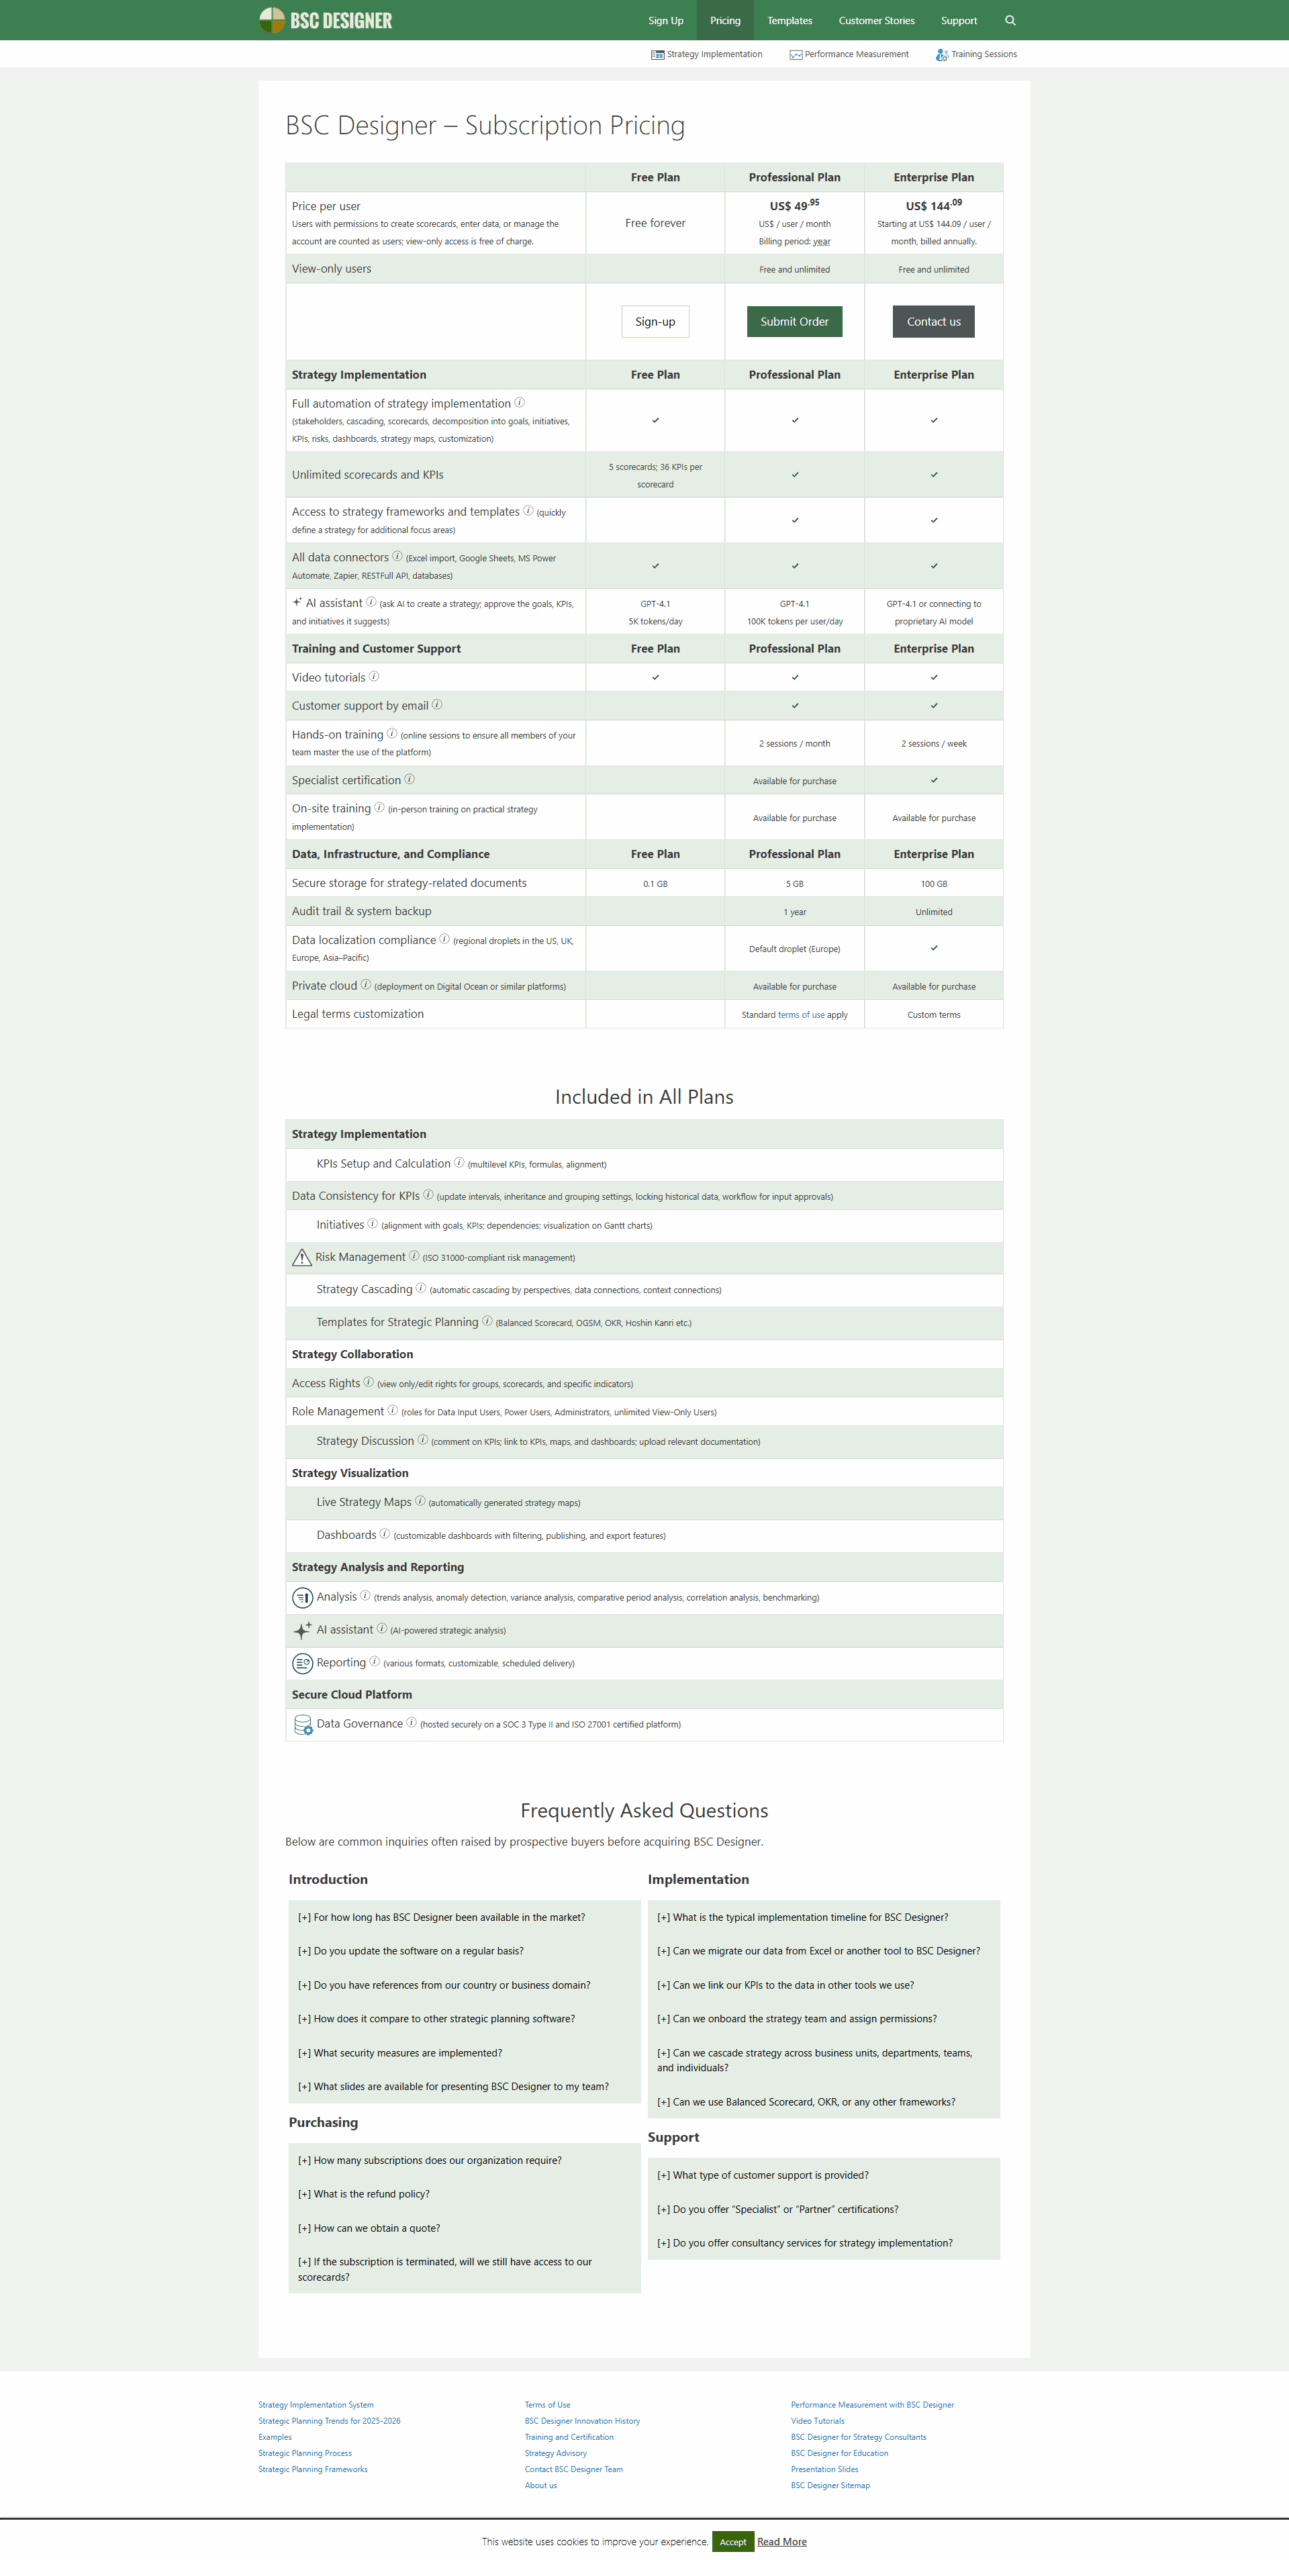
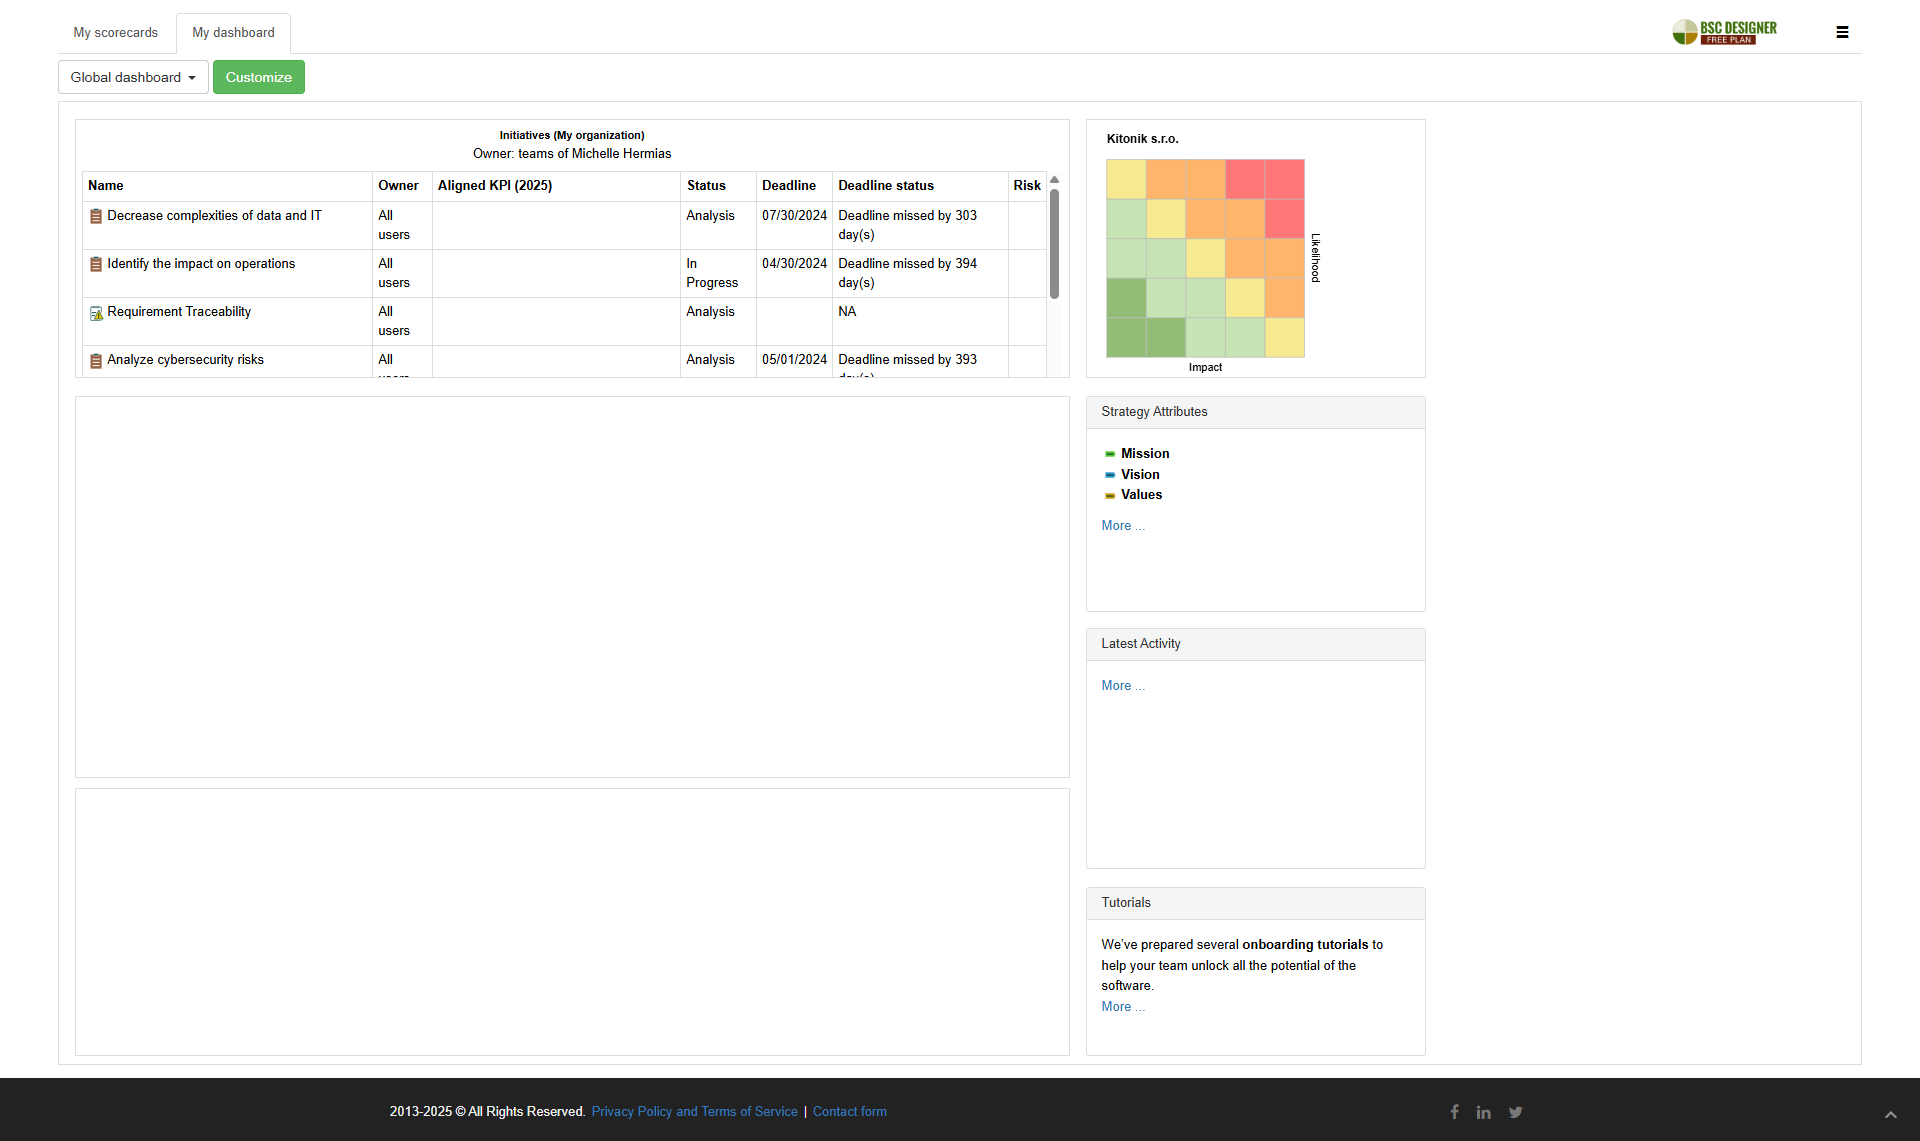
Scoreboard simplifies KPI management by linking strategic goals to business objectives, metrics, and initiatives. Its intuitive drag-and-drop interface enables users to create dynamic dashboards in minutes, updated automatically with real-time data. With powerful reporting and visualization tools, Scoreboard streamlines management reporting, eliminating the need for manual presentations. Ideal for businesses aiming for seamless strategic planning and performance tracking.

Pros and Cons
User-friendly interface and intuitive design
Initial learning curve reported by some users
Top 3 Alternatives
Coming Soon!
Pricing Range
Not specified.
Scoreboard Free Entry Plan: Simplify Team Management for Free - Get Started Today
Forever Free