How to Build an IoT Dashboard Without Writing Code?
- WebOps Platforms Bug Tracking & Feedback Software Web Development & Design Website Builder
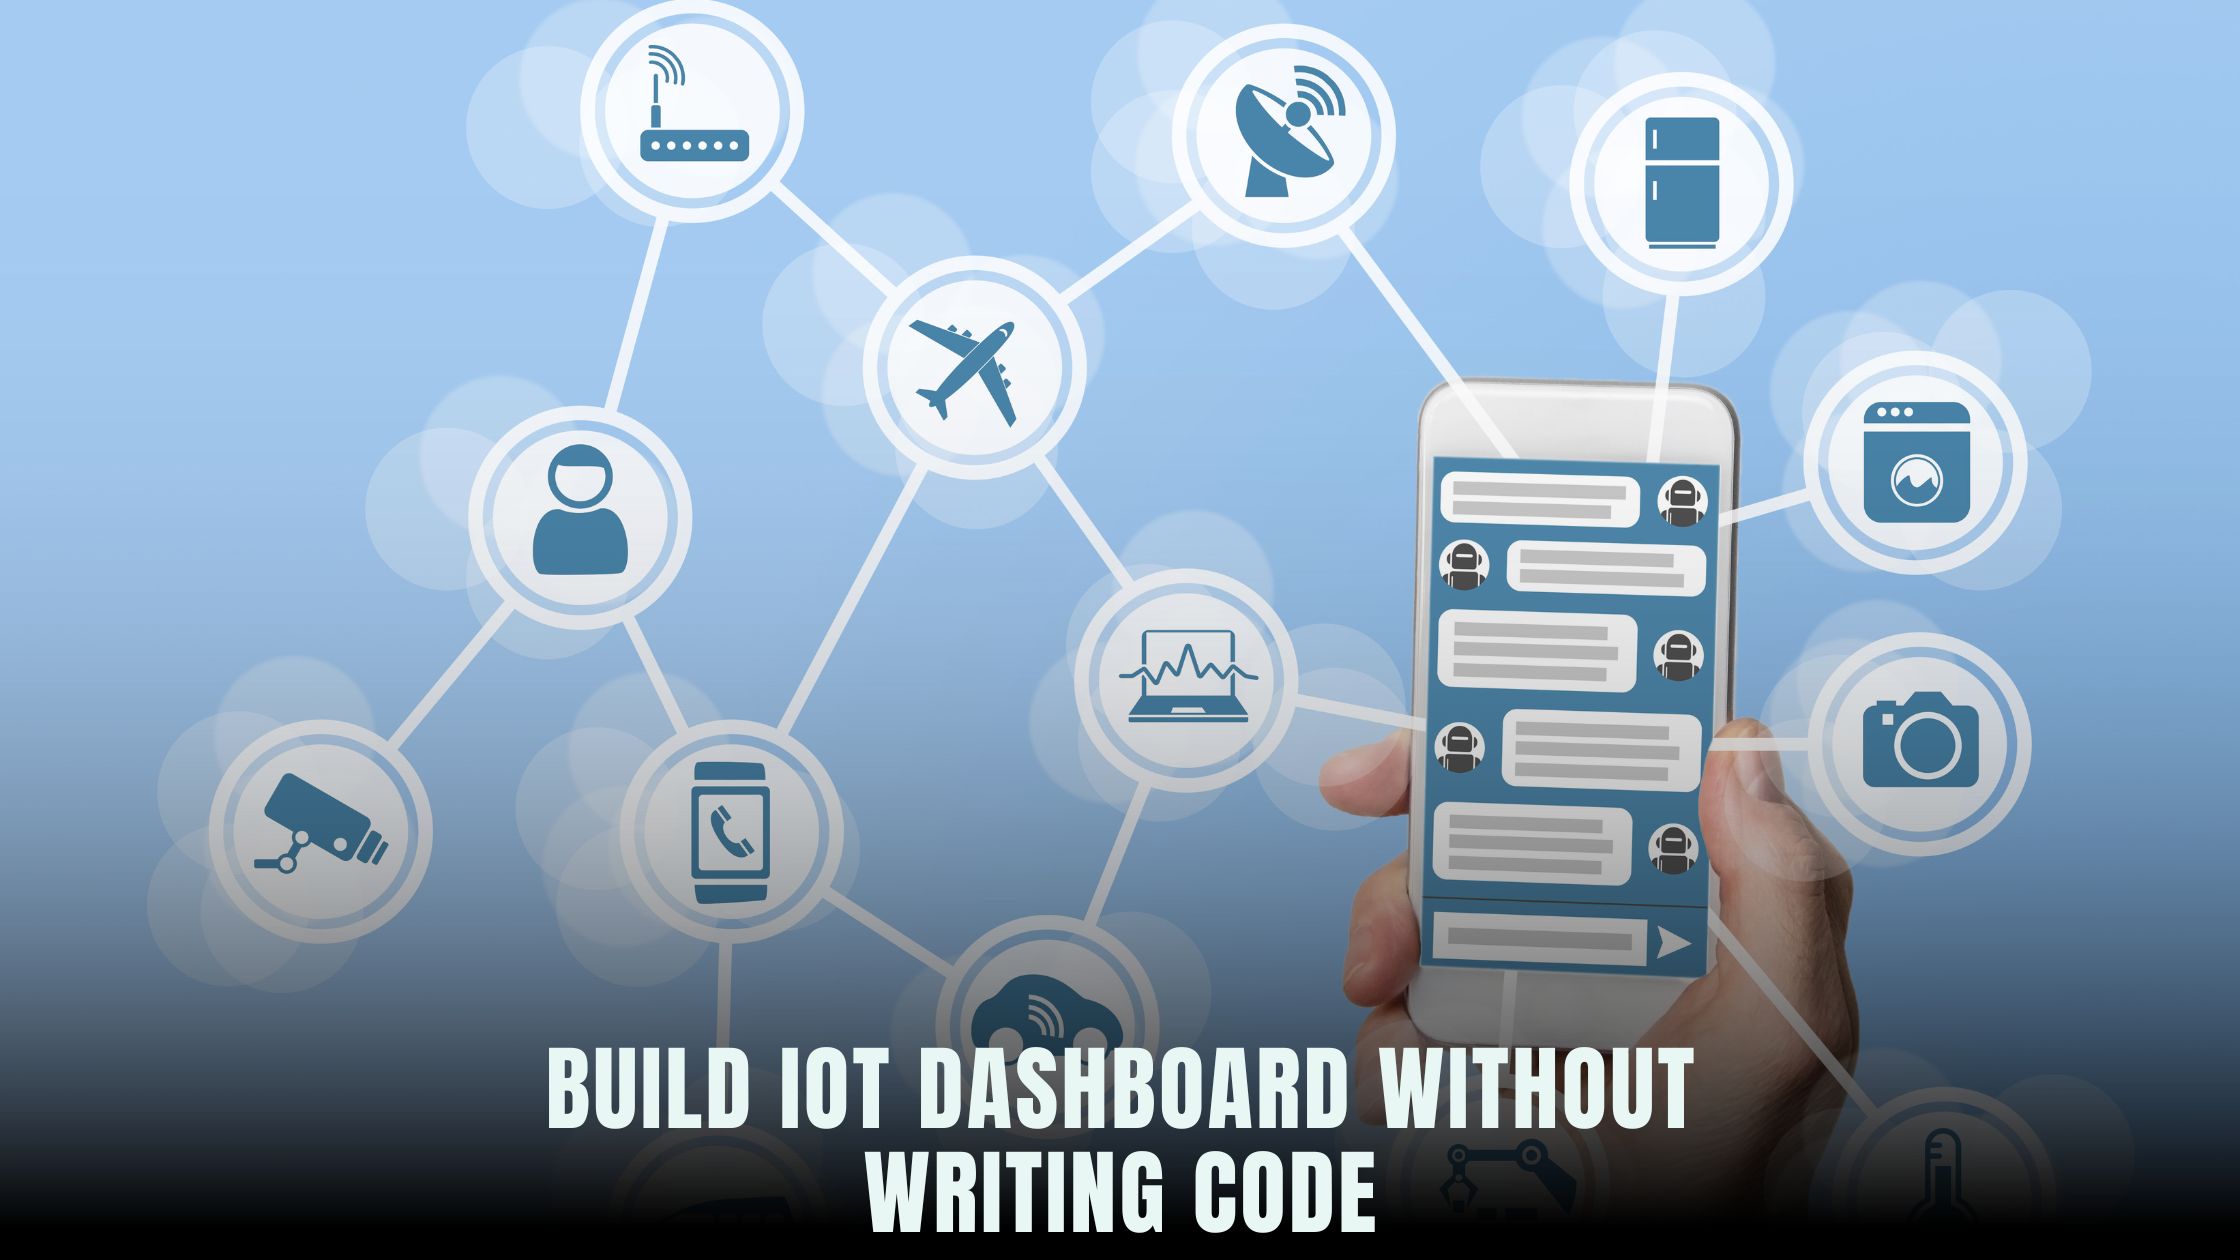

Creating an IoT dashboard typically involves stitching together data pipelines, writing front-end charting code, and provisioning servers for hosting. No-code platforms like Hostinger Horizons have changed the game by bundling AI-driven data integrations, real-time sandbox testing, and one-click deployment into a single interface. If you’re exploring no-code solutions, the Vibe Coding directory highlights tools that excel at connecting to MQTT brokers or HTTP endpoints without a single line of code.
Mapping real-time sensor values to interactive charts used to require manual scripting or complex dashboards. Today, you can simply tell an AI chat assistant to “connect to my MQTT topic sensors/temperature and display a live line chart,” and it builds the dashboard for you. Platforms like Hostinger Horizons handle hosting, SSL, and scaling automatically, freeing you to focus on insights and alerts rather than infrastructure.
Understanding IoT Dashboards and No-Code Platforms
What Does an IoT Dashboard Do?
An IoT dashboard visualizes data from connected devices—temperature sensors, smart meters, motion detectors—so you can monitor system health and user behavior in real time. Dashboards display live charts, gauges, and tables that update automatically as new data arrives. When thresholds are crossed, dashboards can trigger alerts or automated workflows to notify you via email, SMS, or integrations with services like Slack.
Why No-Code Fits IoT
Traditional IoT solutions require backend servers to ingest data, databases to store it, APIs to serve it, and frontend code to display it. No-code platforms collapse these layers into visual interfaces and AI prompts. You define data sources, choose chart types, and configure alerts—all without typing code. This approach speeds up prototyping, reduces development costs, and opens IoT dashboards to non-technical founders and small teams.
Key Components of a No-Code IoT Dashboard
Connecting to MQTT and HTTP Data Streams
Most IoT devices publish data via MQTT or HTTP endpoints. No-code tools let you configure these connections visually. In Hostinger Horizons, you ask “connect to MQTT broker mqtt.example.com on topic home/+/temperature using credentials,” and the platform handles authentication, subscription, and data parsing. For HTTP, you might prompt “fetch JSON data from https://api.example.com/sensor every 5 seconds,” and Horizon sets up the polling routine automatically.
Storing and Transforming Incoming Data
Once data arrives, it needs storage in a time-series database or in-memory cache for real-time display. No-code platforms abstract this too. You define retention policies—how long to keep raw data—and transformation rules for aggregations, such as calculating hourly averages or min/max values. Horizon simplifies this with commands like “aggregate temperature readings by the minute” or “compute rolling 10-point average” before rendering charts.
Chart Types and Widgets
Dashboards rely on various visualization types: line charts for trends, bar charts for comparisons, gauges for thresholds, and tables for raw data. No-code builders provide a library of widgets you drag onto your dashboard canvas. In Horizon’s AI interface, you might say “add a gauge for current humidity with range 0–100” or “place a bar chart of daily energy usage below the header.” The AI generates the appropriate code and links it to your data streams.
Alerts and Notifications
Monitoring alone isn’t enough—you need to know when something goes wrong. Set up alert rules such as “send email if temperature exceeds 80°F for more than 1 minute” or “trigger Slack message when motion sensor is triggered.” No-code dashboards often include alerting modules that integrate with communication services. Horizon’s AI chat can configure multi-channel alerts with a prompt like “alert my team on Slack and email if any critical sensor fails.”
Choosing the Best No-Code Platform for IoT Dashboards
Feature Comparison
When selecting a no-code tool, compare data connectors, visualization options, alerting capabilities, and hosting features. Horizon stands out by bundling AI prototyping with managed hosting on a global CDN, zero-configuration SSL, and 24/7 expert support. Other popular tools include Windsurf for in-depth charting or Lovable AI for emotional design, but they often require separate hosting or plugin setups.
Cost and Scalability
IoT applications can generate high data volumes. Choose a platform that scales storage and compute as your device network grows. Hostinger Horizons offers autoscaling environments that adjust resources based on traffic and data ingestion rates. You pay a predictable subscription fee rather than juggling variable cloud costs. Compare pricing models—flat subscriptions vs. pay-as-you-go—to find the most cost-effective solution for your scale.
Ease of Use and Learning Curve
No-code means no coding, but there’s still a learning curve. Look for intuitive UIs, clear documentation, and community resources. Horizon’s AI assistant reduces complexity: natural-language prompts translate directly into dashboard features. If you prefer a more guided approach, tools like Tempo use step-by-step wizards to build dashboards. Evaluate trial versions to see which interface suits your team’s workflow.
Setting Up IoT Data Workflows Without Code
Configuring MQTT Data Sources
To ingest MQTT data, you configure a broker connection. In a no-code tool, you supply the broker URL, port, and credentials. Horizon guides you through it: “connect to MQTT broker at broker.hivemq.com:1883” then “subscribe to all topics under factory/sensors/#.” The platform validates the connection and shows live topic subscriptions in its sandbox console, so you see incoming messages immediately.
Polling HTTP or Webhook Endpoints
Some IoT devices push data via HTTP webhooks or REST APIs. You define polling intervals or webhook endpoints in the AI console. Horizon’s workflow might look like:
-
“create HTTP endpoint
/webhook/sensorto receive POST requests” -
“every 10 seconds, fetch JSON from
https://api.example.com/data”
You can test these flows live in the sandbox, ensuring data arrives correctly before moving to production.
Transforming and Enriching Data
Raw sensor readings often require calibration or enrichment—such as converting analog values to real units or geo-tagging events. No-code platforms offer transformation modules. In Horizon, prompt “convert sensor voltage to Celsius using formula (value*100)-50” or “add timestamp and device ID fields to each record.” These transformations run automatically before data hits your charts.
Designing Interactive Dashboard Interfaces
Crafting Layouts with Drag-and-Drop
Dashboards should be intuitive. Choose grid layouts or free-form canvases to position widgets. Horizon’s AI let’s you “create a 3-column layout with header, charts, and controls,” then “drag line chart into first column, gauge into second.” Widgets snap to the grid and resize responsively.
Customizing Styles and Themes
Maintain brand consistency by applying color palettes and typography. No-code tools often include theme editors. In Horizon, you upload your style guide—“use primary color #007ACC and font ‘Open Sans’”—and the AI restyles all widgets, ensuring your IoT dashboard aligns with your corporate identity.
Adding Interactive Controls
Allow users to filter data by time range, device group, or custom tags. Add dropdowns, date pickers, or toggles. For example, prompt “add date range selector above charts” or “insert device filter dropdown for ‘Zone A’ and ‘Zone B’.” These controls update all linked widgets dynamically, giving users interactive exploration capabilities.
Deploying and Testing Your Dashboard
Real-Time Sandbox Testing
Before going live, test workflows in a sandbox. Horizon’s real-time preview shows data updates, alert triggers, and UI responsiveness. You can simulate sensor data through the AI console: “simulate temperature=75, humidity=45,” and watch charts respond. This rapid feedback loop identifies errors early.
Publishing to Production
Once testing is complete, publish with a single click. Hostinger Horizons handles domain mapping, SSL certificates, and CDN configuration, ensuring your dashboard is secure, fast, and accessible worldwide. Use the AI prompt “publish dashboard to dashboard.mycompany.com” and Horizon automates DNS updates and certificate issuance.
User Access and Permissions
Control who sees what. Dashboards often require role-based access—admins get full control, while guests see read-only views. Horizon supports permission groups: “create role ‘viewer’ with read-only access” or “invite user alice@example.com as admin.” Permissions sync with your identity provider or simple email invites.
Monitoring and Alerting on Dashboard Health
Performance Monitoring
Keep an eye on dashboard performance. Track metrics like initial load time and widget render times. Ask the AI “enable performance monitoring” and Horizon injects metrics collection into your dashboard, surfaced in an admin panel.
Data Quality Checks
Alerts can notify you when data stops flowing or anomalies emerge. Define checks like “alert if no data received for 5 minutes on topic factory/sensors/temperature” or “notify if value exceeds threshold three times in a row.” Horizon integrates these checks with your alerting channels, so you never miss a critical event.
Scaling Your IoT Dashboard as You Grow
Adding More Devices and Endpoints
As your IoT network grows, simply add more data sources via AI prompts: “add MQTT subscription for warehouse2/sensors/#” or “fetch from new API endpoint https://api2.example.com.” Horizon scales storage and compute automatically, handling thousands of simultaneous connections without manual provisioning.
Managing Multiple Dashboards
Different teams may need specialized dashboards—operations monitors need real-time charts, executives want high-level summaries. Create separate dashboards with shared data sources: “clone ‘Operations Dashboard’ to ‘Executive Summary’” then customize widget layouts and KPIs for leadership.
Integrating with Business Systems
Connect your IoT data to business tools. For instance, push anomaly events to CRMs or ticketing systems: “when temperature alert triggers, create Zendesk ticket.” Horizon handles API calls and data mapping in one prompt, embedding industrial IoT into your broader workflow.
Why Hostinger Horizons Empowers No-Code IoT
Hostinger Horizons stands out for combining AI-driven setup, managed hosting, and robust analytics in one platform. Its AI chat interface eliminates manual configuration of brokers, endpoints, and visualizations—simply describe your needs, and Horizons builds the dashboard. Real-time sandbox testing validates every component before publishing, while autoscaling hosting and global CDN ensure fast, reliable access. With over 80 language supports, image and sketch uploads, and 24/7 expert support, solopreneurs and small teams can deploy production-grade IoT dashboards without a single line of code.
Accelerating Your IoT Insights with No-Code Dashboards
Building an IoT dashboard without coding is not only possible—it’s the new standard for agile teams and startups. By defining data workflows, crafting interactive visualizations, and automating deployment through AI chat, you gain real-time clarity into device performance and user behavior. Hostinger Horizons brings together AI prototyping, seamless hosting, and comprehensive support—empowering you to focus on innovation rather than infrastructure. Start your no-code IoT journey today and turn raw sensor data into actionable insights with unparalleled speed and simplicity.


