Best developer monitoring tools: Datadog alternatives for 2026
- WebOps Platforms Bug Tracking & Feedback Software Web Development & Design
Modern development teams need reliable visibility into how their applications and infrastructure perform. As systems scale, tracking performance, detecting errors, and maintaining uptime become more complex, and relying on expensive, all-in-one platforms like Datadog isn’t always practical.
This guide explores four widely used and cost-effective Datadog alternatives: Prometheus, New Relic, Sentry, and Honeycomb. These tools give teams flexible options for building observability stacks that balance performance, scalability, and cost.
What are monitoring and observability tools?
Monitoring tools collect and display metrics such as CPU usage, response time, and uptime. Observability tools go further by helping you understand why issues happen using logs, traces, and real-time insights.
Most modern platforms include:
- Infrastructure monitoring
- Application performance monitoring
- Error tracking
- Log aggregation
- Alerting
These capabilities are essential for maintaining performance and reliability in production systems.
Best Datadog alternatives for 2026
Below are the top monitoring tools verified from the Subscribed directory, selected for performance, usability, and cost efficiency.
1. Prometheus
Prometheus is an advanced open-source service monitoring system and time-series database designed to empower businesses to actively manage and optimize their IT infrastructure. As a leader in the System Monitoring category, Prometheus delivers deep insights into system health, resource usage, and performance trends, enabling organizations to detect issues well before they impact operations.
Key features
- Time series database
- Powerful query language
- Kubernetes native integration
- Alerting via Alertmanager
Pros
- Free and open source
- Highly scalable
- Strong community support
Cons
- Requires setup and maintenance
- Limited built-in visualization
Best for infrastructure and Kubernetes monitoring
2. New Relic
New Relic is a premier solution in the Application Performance Monitoring category, offering engineers tools to monitor, analyze, and enhance the performance of applications and systems in real time. Its unified observability platform provides comprehensive telemetry collection, powerful analysis tools, and AI-driven insights, ensuring resilience and optimized customer experiences.
Key features
- APM and infrastructure monitoring
- Real-time analytics
- Distributed tracing
- Log management
Pros
- All-in-one platform
- Easy onboarding
- Free tier available
Cons
- Pricing scales with usage
- Can become expensive at scale
Best for teams wanting a Datadog-like experience at a lower entry cost
3. Sentry
Sentry is an essential solution that empowers software teams with deep code-level observability, enabling faster error tracking and performance monitoring. As a leading product in the Application Management category, Sentry offers a comprehensive platform that helps developers gain real-time insights into application health. From frontend interfaces to complex backend systems. With its intuitive dashboards, automated alerts, and detailed transaction mapping, Sentry simplifies the debugging process and enhances overall system stability.
Key features
- Real-time error tracking
- Performance monitoring
- Stack trace analysis
- Release tracking
Pros
- Excellent developer experience
- Fast issue detection
- Strong integrations
Cons
- Limited infrastructure monitoring
- Not a full observability suite
Best for application-level monitoring and debugging
4. Honeycomb
Honeycomb is an advanced solution in the Application Performance Monitoring category, empowering engineering teams to achieve unmatched observability of distributed systems. Designed for modern, cloud-based applications, it provides deep insights by unifying logs, metrics, and traces into a single data model, enabling lightning-fast query performance. With features tailored for high-cardinality data, Honeycomb allows detailed root cause analysis and helps improve system reliability and performance.
Key features
- Event-driven observability
- Distributed tracing
- Real-time debugging
- High-cardinality analysis
Pros
- Excellent for debugging production issues
- Fast querying
- Developer-focused workflows
Cons
- Learning curve
- Pricing depends on event volume
Best for deep observability and debugging complex systems
Feature comparison

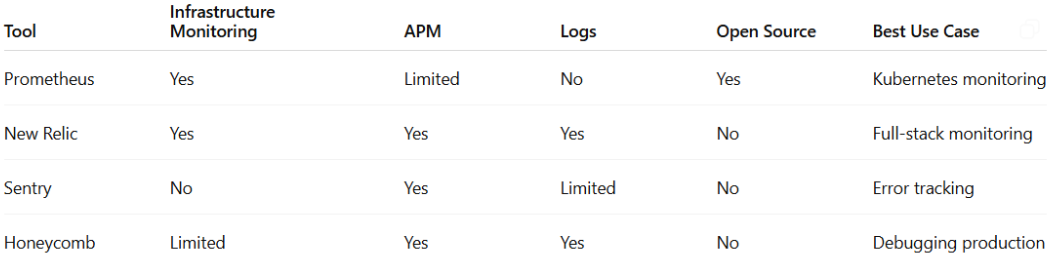
How to choose the right tool
Choose based on your team’s priorities:
- Use Prometheus for cost-effective, open source DevOps monitoring
- Use New Relic if you want a managed, all-in-one platform
- Use Sentry for focused error tracking and debugging
- Use Honeycomb for advanced observability and tracing
For most startups, combining tools is often more cost-efficient than relying on a single expensive platform like Datadog.
Conclusion
The strongest Datadog alternatives in 2026: Prometheus, New Relic, Sentry, and Honeycomb. These tools give teams more control over how they observe and understand their systems. Instead of relying on a single expensive platform, modern engineering teams are shifting toward modular observability stacks that are more adaptable, scalable, and cost-efficient.
References
- Subscribed software directory
- Datadog reviews
- Prometheus reviews
- New Relic reviews
- Sentry reviews
- Honeycomb reviews