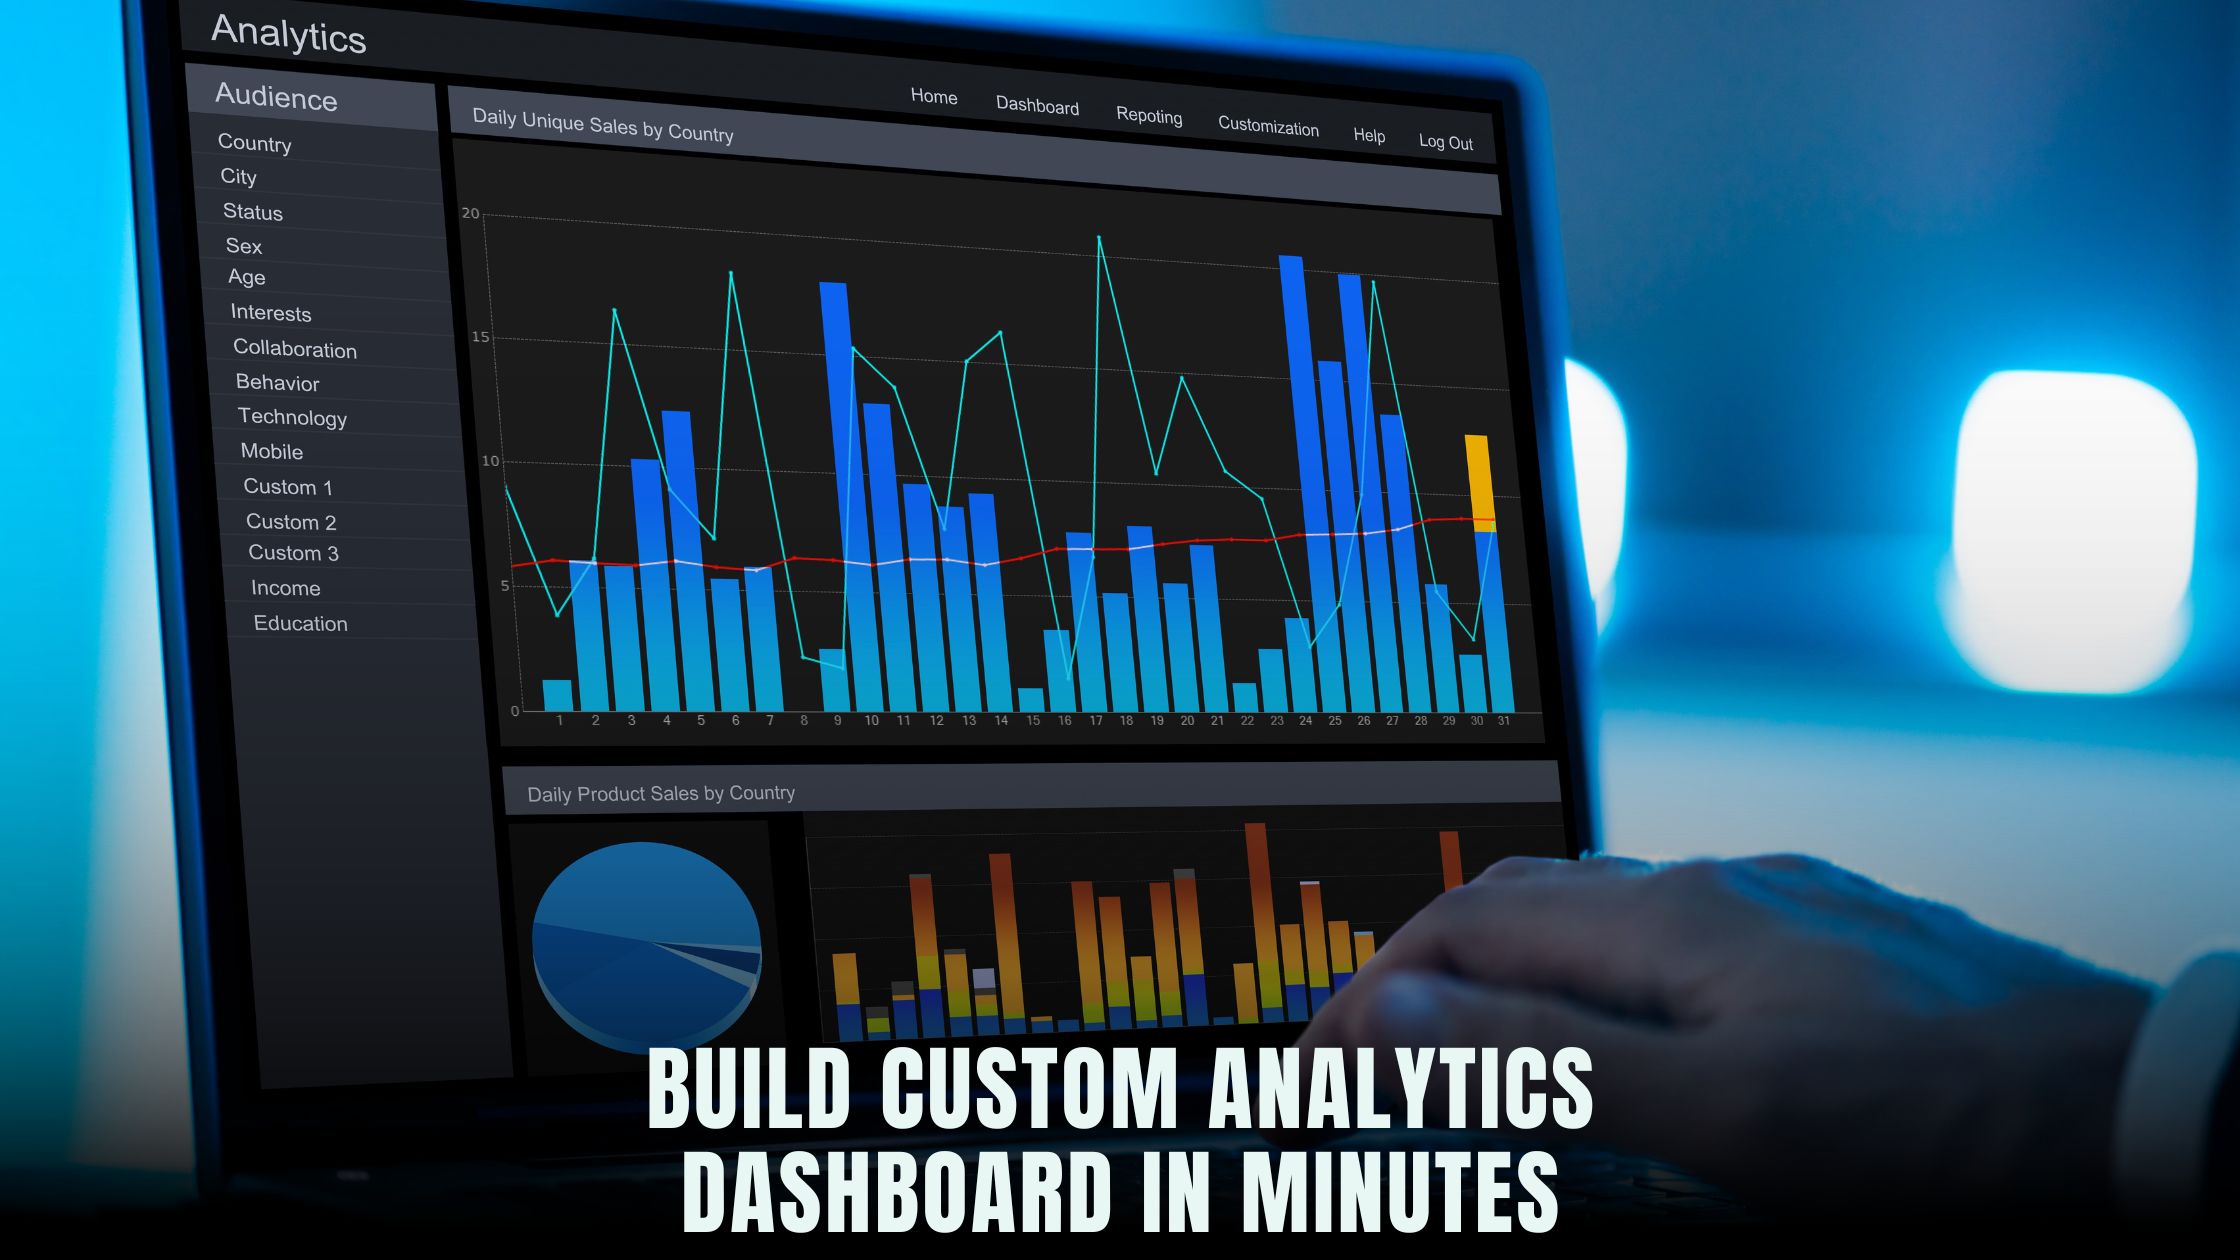
How to Build a Custom Analytics Dashboard in Minutes?
- WebOps Platforms Bug Tracking & Feedback Software Web Development & Design Website Builder
You don’t need a data team or hand-coded charts to watch your key numbers move. With the AI chat builder inside Hostinger Horizons, you can describe the dashboard you want in plain English, see it appear in a real-time sandbox, and publish it to a secure URL when it looks right. If you prefer a familiar charting library, ask Horizons to add Chart.js to your page and bind it to live data—no manual setup. To see where Horizons fits among modern tools, the curated AI-Powered Website Builders roundup is a helpful reference.
This walkthrough shows how to plan the right metrics, connect your sources, generate visuals with Chart.js, and ship a polished dashboard—fast. You’ll also test updates in the sandbox built into Hostinger Horizons, wire simple filters, and add role-based access so teammates can view the board without breaking it. If you like prototyping ideas before you build, you can sketch flows in the Vibe Coding Directory tools, then bring them to life on Horizons in minutes.
What a “custom analytics dashboard” really needs
A good dashboard is honest, fast, and focused. You want a small set of metrics that match a clear goal, like daily signups, active users by plan, revenue this week, and top pages by conversions. It should load quickly on desktop and mobile, let you switch time ranges, and make outliers obvious. You don’t need dozens of charts—just the ones that drive action for your team.
Think in three layers. First comes the data layer (where numbers live—APIs, spreadsheets, or a database). Next is the logic layer (how you group, filter, and merge data). Last is the display layer (charts, tables, and KPIs). Hostinger Horizons helps you express each layer with chat prompts: “Connect our Stripe revenue,” “Group by day,” “Create a bar chart comparing this week vs last week.”
Decide your KPIs before you draw the first chart
Pick what matters this quarter. If you’re a SaaS, think trials started, conversions to paid, churn, and MRR. If you’re a store, think add-to-cart rate, checkout completion, and refund rate. If you publish content, track returning readers, time on page, and newsletter signups. Name each KPI, define how you’ll calculate it, and confirm the data source for each.
If you want inspiration or quick mockups before you build the real thing, try drafting in Lovable or Bolt. Those tools help you outline the structure and copy for panels and cards; then you can ask Hostinger Horizons to recreate that layout and attach live data to it.
Connect data sources without code
Many teams start with data in a few places: Stripe for payments, Google Analytics for traffic, a spreadsheet for campaign notes, and maybe a simple database for app events. In the Horizons chat, say what you want to connect: “Add a data source for Stripe revenue; add a source for Google Analytics 4 users; add a Google Sheet named KPI-Notes.” Horizons will create connectors, prompt you for safe credentials, and show sample rows in the sandbox so you know fields are mapping correctly.
If you keep raw events in a spreadsheet during early testing, Horizons can filter and group it on the fly. Ask for a calculated field—“Net revenue = gross minus refunds”—and it will add the logic so your charts stay correct even as the sheet changes. When you’re ready for something more formal, tools like Tempo and V0 can help you shape naming and structure, then you can swap your sheet connector for an API endpoint later.
Add Chart.js visuals by prompt
Chart.js is a friendly, flexible library that covers line, bar, pie, doughnut, radar, and more. In Hostinger Horizons, you can keep things no-code and still use Chart.js: “Add Chart.js to this page and create a line chart of daily signups for the last 30 days. Use dates on the X axis and counts on the Y axis. Add a moving average.” Horizons installs the library, drops in a canvas element, and binds your chosen dataset.
Clarify the chart type and labels as you go. “Make a stacked bar chart: new vs returning users this week by day.” “Create a doughnut chart of revenue share by plan.” Horizons updates the canvas right away in the sandbox so you can see if the story makes sense. If the ranges look off, ask it to re-scale the axes, add gridlines, or turn on tooltips with exact numbers. If you want a second dataset—say, this week vs last week—ask to overlay it with a separate legend.
Data binding that stays in sync
Data binding links your charts and cards to the underlying data source so you don’t copy/paste numbers ever again. Horizons creates bindings when you ask for a chart or KPI card from a source. You can say, “Bind this KPI card to Stripe revenue for the past 7 days; compare to the prior 7; show a green arrow if up 5% or more.” The AI generates the calculations, and the card refreshes when new data lands.
If you switch sources or rename a field, the sandbox highlights broken bindings so you can fix them before going live. It means your board survives small changes—no brittle code, no silent failures. For more complex logic—like excluding internal traffic—you can add filter prompts: “Exclude requests from our office IPs; keep only UTM source contains ‘newsletter’.”
Real-time updates and live testing
Dashboards feel best when they update on their own. Ask Horizons to refresh tiles on a schedule: “Refresh the revenue chart every 60 seconds; refresh the signups table every 5 minutes.” If you use webhooks—for example, Stripe events—ask for a listener so the chart bumps the moment a payment posts. In the sandbox, you can simulate incoming events to watch tiles animate and totals change.
Real-time is not just fun; it changes how you run launches and promotions. During a big email send, leave the board open and watch traffic, clicks, and orders with a few seconds of lag. Spot a drop in checkout rate and fix it now, not tomorrow. Because Hostinger Horizons lets you push the exact sandbox version live in one click, the board your team trusts in testing is the one they see in production.
Filters, drilldowns, and time ranges
A single board can answer many questions if you add simple filters. Ask for a date range picker and presets like “Today,” “Last 7 days,” and “This month.” Add a plan filter for SaaS, a channel filter for marketing, or a region filter for global stores. When a filter changes, Horizons re-queries the bound data and redraws your Chart.js components.
Drilldowns help you move from “What” to “Why.” Make KPI cards clickable to open a detail page. For example, click “New Trials” and see signups by source, device, and landing page. Ask Horizons to show a top-10 list next to the main chart and link rows to the relevant URL. If you keep content ideas in a Google Sheet, you can open that sheet row from the dashboard to update notes on the fly.
Layout that tells a story
Place your most important KPIs at the top in a clean row of cards. Under that, add a line chart for trend, a bar chart for breakdown, and a short table of “top movers.” Keep a steady visual rhythm: consistent margins, matching heights, and aligned titles. In Horizons, you can request “Make a responsive 12-column grid; stack on mobile; keep gutters generous.” The sandbox shows phone and desktop previews so you don’t guess about spacing.
If you want layout ideas, you can mock a grid in Windsurf or Cursor, then ask Hostinger Horizons to recreate it. Or, ask Horizons to generate “an analytics dashboard layout for a SaaS homepage: KPIs row, trend chart, cohort table, and alerts panel on the right.”
Alerts and thresholds that prevent surprises
A dashboard is great for daily review, but alerts catch spikes and drops while you’re busy. In Horizons, you can add simple rules: “If checkout success rate drops below 90% for 10 minutes, send an email to ops@company.com.” For growth, set upside alerts: “If today’s signups exceed 200 by 3 PM, ping the marketing channel.” These rules watch the same bound data as your charts and run on the hosting that Hostinger Horizons manages, so you don’t need a separate service.
When an alert fires, include a link to the dashboard with the right filters pre-applied. That way the person who clicks arrives already looking at the relevant date range and segment.
Make it accessible and fast
Accessibility makes your board easier for everyone. Ask Horizons to attach labels to inputs, add aria-live regions to announce error messages, and ensure color contrast for chart lines and text. For Chart.js, request titles and legends that screen readers can parse, plus a summary table under each chart so data is available in text as well.
Speed matters, too. Horizons serves pages on fast hosting with SSL and a global CDN, but you can still help. Reduce the number of heavy charts on the first view. Lazy-load secondary panels and use skeleton states while data fetches. If you’re pulling from APIs with strict rate limits, ask Horizons to cache responses for a minute so the same data can feed several components without hammering the source.
Security for data and access
Dashboards often contain sensitive numbers. In Horizons, keep secrets like API keys in encrypted variables, not on the page. Define roles so editors can change layout and viewers can only filter and read. For internal boards, restrict access by login or IP allow-list. When you publish, use a private URL for the team and, if needed, a separate public version with only high-level stats.
Always test permissions in the sandbox with a viewer role. Confirm that restricted users cannot see developer panels, secrets, or staging URLs. If your board shows customer information, mask email addresses except for the last few characters, and never render raw tokens in the DOM.
Ship a “minimum lovable dashboard” first
You’re better off shipping a small, helpful board today than a perfect one next month. Start with four core items: a KPI row, a main trend, a simple breakdown, and a table of top events or pages. Ask Hostinger Horizons to drop a “todo panel” on the right so you can keep a running list of tweaks. As you learn, add a second page for finance, a third for marketing, and a fourth for support.
If you want help crafting copy or labels, quick prompt tools like Lazy AI and Fine AI can spitball names for KPIs and panels, which you then refine inside Horizons. The goal is clarity—not cleverness—so people know what they’re seeing at a glance.
A/B test layouts and copy on the dashboard
You can treat dashboard UX like any other interface. Ask Horizons to clone your board as Variant B: tighter margins, fewer decimals, short labels. Split traffic between versions for a week and see which one gets faster “time to answer” based on how quickly teammates find what they need. Keep the winner and roll the rest back with version history.
If you want a fast playground for ideas before you commit, sketch variations in Tempo or V0. Then, when you’re ready, say “Apply Variant B layout to the live board” in Horizons and publish with one click.
Maintenance without headaches
Dashboards never sit still. Metrics change, sources update, and goals shift. Horizons keeps a version snapshot each time you publish, so if a change confuses people you can revert to the last stable version. Because bindings and filters are declared through prompts, you can skim what changed in plain English instead of diffing code.
Schedule a short weekly review. Remove panels nobody uses. Promote useful secondary charts to the main view. Retire anything that no longer ties to a goal. The dashboard stays lean, and your team trusts it more each month.
Where other modern tools fit in
Some teams like drafting in code-like editors before they move to no-code. If that’s you, open Windsurf or Cursor and rough in data shapes or UI text. If you want an overview of other builders that blend AI and site creation, skim the AI-Powered Website Builders list to see how they compare on speed, hosting, and integrations. The point is not to collect tools; it’s to turn a question into a chart someone can trust—today.
When you’re ready to ship, move the idea into Hostinger Horizons so you get bundled hosting, SSL, domains, and a global CDN, plus the real-time sandbox that makes testing painless.
How Horizons makes dashboards happen in minutes
Hostinger Horizons turns a one-line idea into a working board. You describe the tiles you want—KPI cards, line and bar charts with Chart.js, a filter bar with date and plan pickers—and the AI assembles the page with smart defaults. The sandbox shows your data and visuals at once, so you can tweak labels, units, or scales without switching tools. When you ask for “Refresh every minute” or “Add a rolling 7-day average,” Horizons updates the query and redraws the canvas in real time. Because hosting, SSL, and caching are included, it publishes the exact version you tested to a neat URL in one click.
After launch, Hostinger Horizons helps you operate the board like a tiny product. Bind new data sources by prompt. Translate labels into 80+ languages if you share the board with global teams. Set alert rules that email you when a metric crosses a threshold. Create a Variant B layout to reduce clutter and compare results. If a change misses the mark, roll back with version history. The result is a dashboard that moves at the speed of your questions—without developers in the loop.
From question to insight: your next hour
Set a clear goal, pick four KPIs, and gather your sources. Open Hostinger Horizons and ask for a “SaaS weekly dashboard” with KPI cards for trials, conversions, churn, and MRR. Add a line chart of signups with a 7-day average, a stacked bar of new vs returning users, and a table of top landing pages. Bind each tile to a source. Add filters for date range and plan. Ask Horizons to use Chart.js for visuals with tooltips and legends. In the sandbox, test edge cases, change labels, and check mobile. Publish. Share the link with your team and set two small alert rules for dips and spikes.
That hour invests in a ritual you’ll keep: open the board each morning, scan the trend, click into the breakdown, and decide one action. When the board makes that action obvious, you built the right thing. And when a question appears that the board cannot answer yet, add a panel. That’s the beauty of a dashboard you can change in minutes.