Sign in to review
Join our community of software reviewers on Subscribed.fyi

Continue With Google
Continue With LinkedIn
Continue Review with Email
Continue with Email
Enter your email to continue.
Continue
Enter your password
Enter your password to finish setting up your account.
Continue
Activate your email
Enter activation code we sent to your email.
Submit
Reset your password
Enter activation code we sent to your email.
Submit
Set your new password
Enter a new password for your account.
Submit
Categories
For Business
Log in
Provide My Insights
Add Product
Suggested products People also compare with
Add to Comparison
Suggested products People also compare with

Compare Orange and IBM SPSS Statistics

We are comparing Orange and IBM SPSS Statistics to evaluate which one is the best product.

Suggested products People also compare with
Review Pricing Alternatives Experience

Review

61%
21/36 Metric achieved
75%
26/36 Metric achieved

Subscribed Metric

Customer Support 4/6
Security 0/6
Ease of Use 5/6
Value of Money 5/6
Integration 2/6
Popularity 5/6

Subscribed Metric

Customer Support 4/6
Security 4/6
Ease of Use 5/6
Value of Money 4/6
Integration 3/6
Popularity 6/6

Pros & Cons

User-friendly interface for beginners.
Effective for data visualization and analysis.
Supports various input formats like CSV, SQL, and Excel.
Good for machine learning and predictive modeling.
Graphs cannot be exported in raw form.
Live data visualization is not supported.
Errors in data are difficult to trace.
Consumes substantial system resources with large datasets.

Pros & Cons

User-friendly interface with intuitive features
Supports a wide range of statistical tests
Efficient data cleaning and automation tools
Handles large datasets effectively
Expensive for small organizations or individuals
Graphics and charts are not visually appealing
Requires a steep learning curve for advanced features
Performance drops with very large datasets

Conclusion

Orange is an open-source statistical analysis tool enabling users like business analysts, researchers, and data scientists to perform machine learning, data visualization, and predictive modeling. With drag-and-drop workflows and user-friendly UI, it supports importing data in formats like CSV, Excel, or SQL. Key benefits include support for statistical/machine learning models and beginner accessibility. Compared to KNIME or IBM SPSS, Orange lacks live data integration or advanced customizations. However, its cost-effectiveness (free) and features appeal to small teams. Customer support is rated moderate but sufficient, making it ideal for non-programmers exploring data insights. Avoid if real-time data analytics or cloud APIs are critical.

Conclusion

IBM SPSS Statistics is a feature-rich statistical analysis tool ideal for researchers, analysts, and data scientists. It simplifies data preparation, visualization, and advanced analytics using a user-friendly interface while supporting Python/R integration. Pros include diverse statistical tests and automation. Its high cost ($99/month to $3,830 one-time) and resource intensity may deter individual or small-scale users. While alternatives like R (free) or Stata offer flexibility, SPSS excels in accessibility and support. Strong customer service adds value but may lack cost-effectiveness for budget-sensitive buyers.

Pricing

Orange Pricing

Pricing Range Not specified

IBM SPSS Statistics Pricing

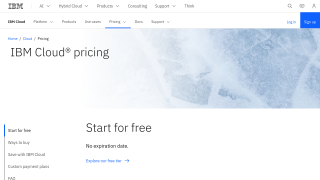
Pricing Range $4.523-$45.00/Month See IBM SPSS Statistics Pricing

Alternatives

Orange Alternatives

KNIME Analytics Platform logo

KNIME Analytics Platform

86%
IBM SPSS Statistics logo

IBM SPSS Statistics

75%
See All Orange Alternatives

IBM SPSS Statistics Alternatives

IBM SPSS Modeler logo

IBM SPSS Modeler

75%
EViews logo

EViews

73%
Stata logo

Stata

63%
See All IBM SPSS Statistics Alternatives

Experience

Orange Screenshots

Orange screenshot 1

IBM SPSS Statistics Screenshots

IBM SPSS Statistics screenshot 1
IBM SPSS Statistics screenshot 2