Statistical Analysis Solutions for Business Growth
Log in to leave your review.
Join our community of software reviewers on Subscribed.fyi

Continue With Google
Continue With LinkedIn
Continue Review with Email
Continue with Email
Enter your email to continue.
Continue
Enter your password
Enter your password to finish setting up your account.
Continue
Activate your email
Enter activation code we sent to your email.
Submit
Reset your password
Enter activation code we sent to your email.
Submit
Set your new password
Enter a new password for your account.
Submit
✨ Ask AI Search
Categories
For Business
Log in
Provide Insight

Statistical Analysis

In today's data-driven business landscape, Statistical Analysis tools are indispensable for organizations of all sizes, from small startups to large enterprises, seeking to enhance their operations, efficiency, and growth. These advanced business solutions empower companies across various...

More Details

In today's data-driven business landscape, Statistical Analysis tools are indispensable for organizations of all sizes, from small startups to large enterprises, seeking to enhance their operations, efficiency, and growth. These advanced business solutions empower companies across various industries to make informed, data-backed decisions by analyzing, visualizing, and interpreting complex data sets. Statistical Analysis tools, such as SAS, SPSS, and other SaaS software, offer a myriad of features including ease of use, scalability, and seamless integration with existing systems. They enable businesses to perform a wide range of statistical tests, from descriptive statistics and regression analysis to predictive modeling and text analysis, all while providing robust data management and visualization capabilities. Whether you need to handle large datasets efficiently, automate repetitive tasks, or create interactive reports and dashboards, these tools are designed to cater to diverse business needs. By leveraging these Statistical Analysis tools, businesses can gain deeper insights into their performance, identify trends, and innovate strategies to stay ahead in the market. Discover how the right Statistical Analysis tools can transform your business operations and drive growth with our comprehensive selection of business solutions.

Less Details

2 Products available

#1

ATLAS.ti is an intuitive and powerful software for qualitative and mixed-method data analysis. It enables users to analyze, code, visualize, and derive insights from a variety of data formats, including interviews, surveys, and videos. With AI-powered tools, cross-platform compatibility, and real-time collaboration features, it streamlines research workflows for professionals and academics across diverse fields. Backed by responsive support, ATLAS.ti simplifies complex research processes while ensuring flexibility and efficiency.

Pros and Cons
Intuitive coding and analysis features
Learning curve for new users
Top 3 Alternatives
Pricing Range
$4.1-$153.3/Month
ATLAS.ti Free Trial: Explore AI Capabilities for 5 Days!
5-Day Free Trial
#2

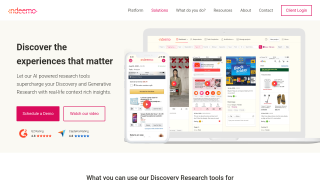
Indeemo is an intuitive video research platform designed to capture in-the-moment insights into user behaviors, emotions, and experiences. With features like diary studies, journey mapping, and usability testing, it supports B2C and B2B research for MR, UX, and CX teams. Its mobile app facilitates rich multimedia feedback, while AI-powered analysis tools streamline transcription, translation, and insight generation. Trusted by global organizations, Indeemo combines flexibility, user-friendliness, and robust data analysis for impactful qualitative research.

Pros and Cons
Highly responsive customer support
Limited customization for data visualization
Top 3 Alternatives
Pricing Range
Not specified
Indeemo Custom Pricing: Tailor Your Plan for Maximum Savings
Custom Pricing for Teams of Every Size

What is Statistical Analysis?

Statistical Analysis software is a suite of tools designed to analyze and interpret complex data sets, providing insights that drive decision-making. The primary purpose of Statistical Analysis software is to help users extract meaningful information from data through various statistical methods, including descriptive statistics, inferential statistics, and predictive modeling. These solutions are essential for conducting surveys, data mining, market research, and other analytical tasks, making them indispensable in the fields of social sciences, healthcare, finance, and more.

Overview

Statistical Analysis software is widely applied across multiple industries, including education, government, healthcare, and finance. This category of software addresses common business challenges such as data-driven decision-making, market trend analysis, and predictive modeling. The primary benefits include enhanced data visualization, improved accuracy in forecasting, and the ability to uncover hidden patterns within large datasets. By leveraging Statistical Analysis software, organizations can gain valuable insights, optimize operations, and stay competitive in their respective markets.

Who use it?

Statistical Analysis software is utilized by a diverse range of businesses and professionals. Small businesses use it for market research and customer behavior analysis, while medium and large enterprises employ it for comprehensive data analysis and predictive modeling. Industry-specific roles such as data analysts, market researchers, health researchers, and quality assurance professionals in manufacturing also rely heavily on these tools. Additionally, educational institutions and government entities use Statistical Analysis software for research, policy development, and program evaluation.

Key Element

The key elements of Statistical Analysis software include advanced statistical techniques such as regression analysis, analysis of variance (ANOVA), hypothesis testing, and cluster analysis. These tools offer robust data management capabilities, enabling users to import, clean, transform, and merge data from multiple sources. Other important features include data visualization options for creating informative charts and graphs, predictive modeling capabilities, and integration with various data management systems and databases. Standout features often include text analysis, decision trees, neural networks, and report generation tools, which enhance the overall analytical process.