Columns Reviews 2026: Details, Pricing, & Features | Subscribed.fyi
Sign in to review
Join our community of software reviewers on Subscribed.fyi

Continue With Google
Continue With LinkedIn
Continue Review with Email
Continue with Email
Enter your email to continue.
Continue
Enter your password
Enter your password to finish setting up your account.
Continue
Activate your email
Enter activation code we sent to your email.
Submit
Reset your password
Enter activation code we sent to your email.
Submit
Set your new password
Enter a new password for your account.
Submit
Categories
For Business
Log in
Provide My Insights

Columns Reviews, Pricing, Features & Alternatives (2026)

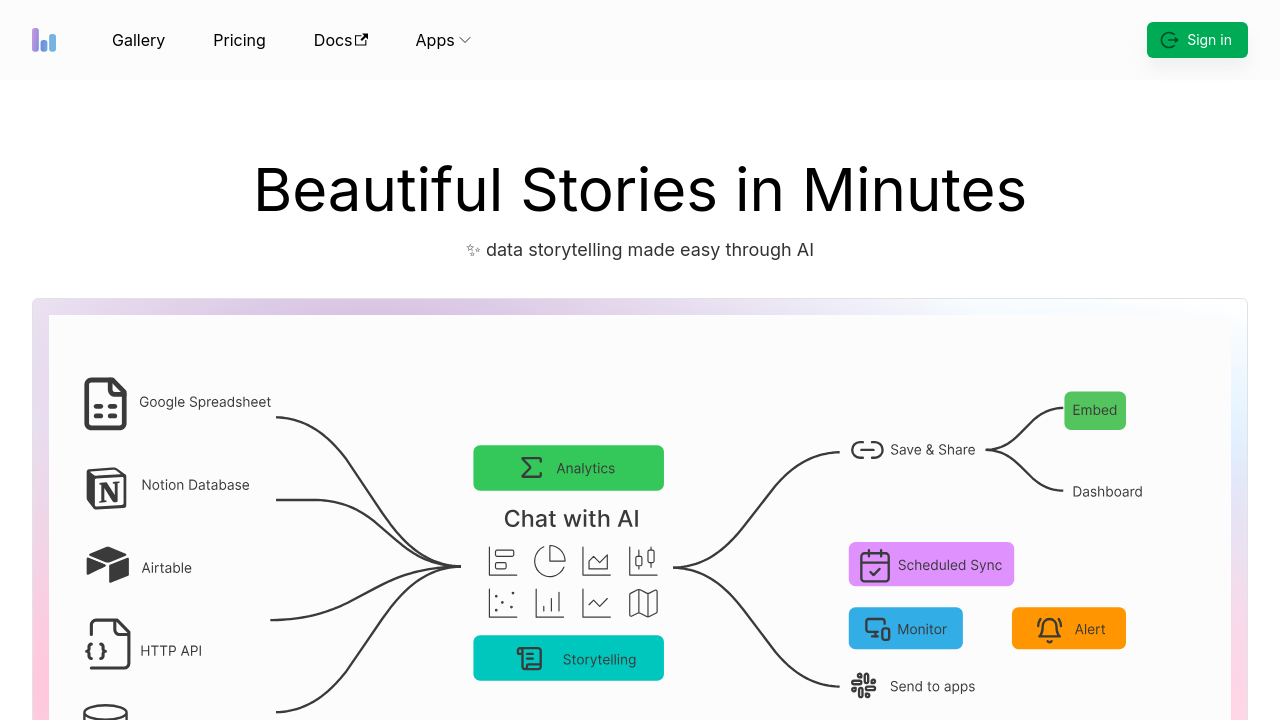
Columns is an AI-powered data visualization and storytelling platform designed to simplify complex data insights. With its intuitive interface and natural language capabilities, users can create visually engaging charts, maps, and dashboards in minutes. Seamlessly connect data from various sources and design compelling presentations with ease. Columns empowers teams to communicate insights effectively and creatively.

Columns Overview

What is Columns?

N/A
0
Reviews
73%
Subscribed Score

Available for Claim - This listing is available to be claimed
Claim Profile For Free

Unclaimed

Manage profile with subsig, and unlock 23+ social and review monitoring. Get partnership options with

Claim Profile For Free

Why teams choose Columns

Key Features

Works Anywhere
Works Anywhere
Accessible from any device, anytime.
Data-Driven Insights
Make better decisions with analytics.
Plug & Play Setup
Plug & Play Setup
Get started in minutes, not weeks.

Who is Columns for?

Columns is a dynamic solution in the Data Visualization category, offering teams the ability to craft visually compelling data stories effortlessly. Leveraging AI, Columns transforms datasets into beautifully designed visualizations in as little as five minutes, making it an intuitive solution for both technical and non-technical users. Often described as “Canva for data,” it enables users to unlock and maximize their storytelling potential with seamless integrations and simple design features. Explore exclusive deals. For similar solutions, consider Excel Chart Animation, Tableau, and MATLAB.

Why Use Columns?

Selecting Columns for your data storytelling needs unlocks a host of benefits:

  • AI-Driven Visualizations: Generate stunning charts, maps, and graphs using natural language or AI recommendations, simplifying the data visualization process.
  • End-to-End Storytelling: Transition effortlessly from raw data to a polished story ready to share, embed, or present with minimal effort.
  • Seamless Integrations: Incorporate live data from sources like Google Sheets, Notion, Airtable, or CSV for evergreen visualizations that auto-update as needed.
  • Ease of Use: Designed for accessibility, Columns supports both quick onboarding for beginners and advanced customization for experienced users.

Who is Columns For?

Columns appeals to diverse user groups and industries:

  • Small Businesses: Perfect for those managing data with limited resources, offering an affordable and intuitive way to present insights.
  • Marketers: Enables the creation of striking visualizations to enhance presentations and campaigns with data insights.
  • Educators and Analysts: Provides a simple platform for translating complex data into digestible and impactful visual formats.
  • Freelancers and Non-Technical Users: Facilitates professional-grade storytelling without the steep learning curve of traditional BI tools.

Whether you’re a DIY data storyteller, business professional, or creative, Columns offers a robust and efficient platform to elevate your data presentations. Its straightforward functionality, coupled with AI insights, makes it an ideal choice for organizations and individuals aiming to simplify and enhance their data-driven narratives.


Columns Summary

Columns is a dynamic solution in the Data Visualization category, offering teams the ability to craft visually compelling data stories effortlessly. Leveraging AI, Columns transforms datasets into beautifully designed visualizations in as little as five minutes, making it an intuitive solution for both technical and non-technical users. Often described as “Canva for data,” it enables users to unlock and maximize their storytelling potential with seamless integrations and simple design features. Explore exclusive deals. For similar solutions, consider Excel Chart Animation, Tableau, and MATLAB.

Why Use Columns?

Selecting Columns for your data storytelling needs unlocks a host of benefits:

  • AI-Driven Visualizations: Generate stunning charts, maps, and graphs using natural language or AI recommendations, simplifying the data visualization process.
  • End-to-End Storytelling: Transition effortlessly from raw data to a polished story ready to share, embed, or present with minimal effort.
  • Seamless Integrations: Incorporate live data from sources like Google Sheets, Notion, Airtable, or CSV for evergreen visualizations that auto-update as needed.
  • Ease of Use: Designed for accessibility, Columns supports both quick onboarding for beginners and advanced customization for experienced users.

Who is Columns For?

Columns appeals to diverse user groups and industries:

  • Small Businesses: Perfect for those managing data with limited resources, offering an affordable and intuitive way to present insights.
  • Marketers: Enables the creation of striking visualizations to enhance presentations and campaigns with data insights.
  • Educators and Analysts: Provides a simple platform for translating complex data into digestible and impactful visual formats.
  • Freelancers and Non-Technical Users: Facilitates professional-grade storytelling without the steep learning curve of traditional BI tools.

Whether you’re a DIY data storyteller, business professional, or creative, Columns offers a robust and efficient platform to elevate your data presentations. Its straightforward functionality, coupled with AI insights, makes it an ideal choice for organizations and individuals aiming to simplify and enhance their data-driven narratives.

Columns reviews and insights

Learn what people say about Columns

N/A
0 Reviews
73%
Subscribed Score

Lear more here about the Subscribed score on how it is composed. Learn more Click here

Overall rating

5
4
3
2
1
CX 6/6

How good is the customer support based on subscribed’s assessment

CX Icon
Security 4/6

How secure is the product based on Subscribed’s assessment?

Security Icon
Ease of Use 5/6

How easy is the product to use, based on Subscribed’s assessment?

EOU Icon
Value 5/6

What is the value for money based on Subscribed’s assessment?

coin Icon
Integration 4/6

How many integrations does the product offer?

gear Icon
Popularity 3/6

How popular is the product?

star

No Reviews Yet!

Be the first to share your experience and help others in the community.

Columns User Reviews

0 User Reviews

Reviews from G2, Capterra, Trustpilot
info Icon

These ratings come directly from third-party platforms like G2, Capterra, and Trustpilot. They reflect real user feedback collected independently on those sites.

Columns pricing

Pricing model

Pricing Range
info Icon

This only an estimated pricing range, visit Columns pricing page to access all the information by clicking “Visit Now”.

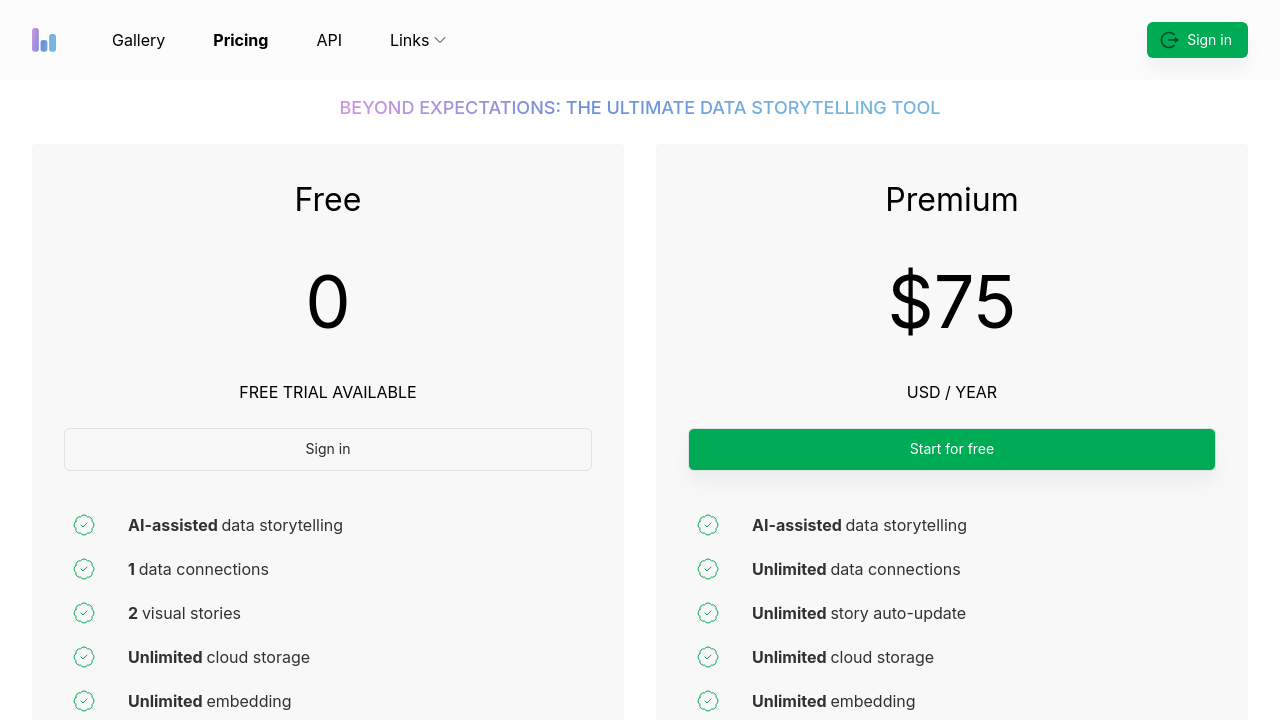
$0-$12.99 / Month
Deals Available

This product comes with a special deal, see details

Visit Now
✨ Ask AI about pricing
73% Subscribed Score
info Icon

The Subscribed Score is an independent rating that combines user reviews, features, and value-for-money from multiple trusted sources. It’s designed as a quick benchmark, not a guarantee of individual experience.

Overview

Columns is a dynamic solution in the Data Visualization category, offering teams the ability to craft visually compelling data stories effortlessly. Leveraging AI, Columns transforms datasets into beautifully designed visualizations in as little as five minutes, making it an intuitive solution for both technical and non-technical users. Often described as “Canva for data,” it enables users to unlock and maximize their storytelling potential with seamless integrations and simple design features. Explore exclusive deals. For similar solutions, consider Excel Chart Animation, Tableau, and MATLAB.

Why Use Columns?

Selecting Columns for your data storytelling needs unlocks a host of benefits:

  • AI-Driven Visualizations: Generate stunning charts, maps, and graphs using natural language or AI recommendations, simplifying the data visualization process.
  • End-to-End Storytelling: Transition effortlessly from raw data to a polished story ready to share, embed, or present with minimal effort.
  • Seamless Integrations: Incorporate live data from sources like Google Sheets, Notion, Airtable, or CSV for evergreen visualizations that auto-update as needed.
  • Ease of Use: Designed for accessibility, Columns supports both quick onboarding for beginners and advanced customization for experienced users.

Who is Columns For?

Columns appeals to diverse user groups and industries:

  • Small Businesses: Perfect for those managing data with limited resources, offering an affordable and intuitive way to present insights.
  • Marketers: Enables the creation of striking visualizations to enhance presentations and campaigns with data insights.
  • Educators and Analysts: Provides a simple platform for translating complex data into digestible and impactful visual formats.
  • Freelancers and Non-Technical Users: Facilitates professional-grade storytelling without the steep learning curve of traditional BI tools.

Whether you’re a DIY data storyteller, business professional, or creative, Columns offers a robust and efficient platform to elevate your data presentations. Its straightforward functionality, coupled with AI insights, makes it an ideal choice for organizations and individuals aiming to simplify and enhance their data-driven narratives.

Where Columns performs best

What users like
  • Ease of use for non-technical users
  • Creates visualizations quickly
  • Affordable compared to alternatives
  • Supports various data sources

Where Columns falls short

What users dislike
  • Limited advanced features
  • Needs aesthetic UI improvements
  • Lacks some standard BI tools
  • Complexity for mastering full potential
Subscribed Score Metrics
27/36 Metric achieved
MetricsScore
Customer Support6/6
Security4/6
Ease of Use5/6
Value of Money5/6
Integration4/6
Popularity3/6
Radar Chart Table View
Ease of Use
Measures how simple and intuitive the product is to use, including setup, navigation, and overall user experience
5/6 Metric Checks
Security
Compares the product`s features, quality, and pricing to determine its overall cost-effectiveness.
4/6 Metric Checks
Value of Money
Assesses the product`s ability to protect data, prevent breaches, and comply with industry standards.
5/6 Metric Checks
Customer Support
Reflects the responsiveness, helpfulness, and quality of assistance provided by the product`s support team.
6/6 Metric Checks
Integrations
Evaluates how well the product connects with other tools and platforms, enabling seamless workflows.
4/6 Metric Checks
Columns Pricing Range
$0-$12.99 / Month

Columns in action
info Icon

A curated gallery of real screenshots and use cases from the product, so you can see how it works before trying it.

Columns Full Screen Icon
https://www.youtube.com/watch?v=My3wvJlQDqc
Full Screen Icon
https://www.youtube.com/watch?v=Jr_ylwvxcQg
Full Screen Icon
Columns
Columns
Video thumbnail
Video thumbnail
Columns
Columns

Alternatives to Columns
info Icon

A list of platforms similar to Columns, helping you evaluate which tool best matches your needs.

empty stats

No Alternatives Found

Looks like we cannot found any other relevant product at this moment

✨ Ask All alternative with AI

How to cancel Columns

Need to cancel Columns? Here is how
info Icon

Thinking about how to cancel Columns this is how you do it!

To delete columns using AI in Excel:

  • Open your spreadsheet and activate the AI tool (e.g., "Ideas" or "Analyze Data" button).
  • Request column analysis, such as "Which columns are redundant?"
  • Review AI suggestions for columns to delete.
  • Select and delete the recommended columns manually or through AI options.

Always double-check AI suggestions to ensure data integrity.

How to Cancel the Columns

To delete columns using AI in Excel:

  • Open your spreadsheet and activate the AI tool (e.g., "Ideas" or "Analyze Data" button).
  • Request column analysis, such as "Which columns are redundant?"
  • Review AI suggestions for columns to delete.
  • Select and delete the recommended columns manually or through AI options.

Always double-check AI suggestions to ensure data integrity.

FAQs about Columns

Every else you need to know about Columns
info Icon

A collection of FAQs, guides, alternatives, and comparisons to help you quickly understand if Columns is right for you.

Manage your Columns profile

Create profile

Want to list your product on Subscribed.fyi? Create a profile to reach more buyers.

Pricing Range
info Icon

This only an estimated pricing range, visit Columns pricing page to access all the information by clicking “Visit Now”.

$0-$12.99 / Month
Visit Now
Deals Available

This product comes with a special deal, see details

This product comes with a special deal, see details