Plotly Reviews 2026: Details, Pricing, & Features | Subscribed.fyi
Sign in to review
Join our community of software reviewers on Subscribed.fyi

Continue With Google
Continue With LinkedIn
Continue Review with Email
Continue with Email
Enter your email to continue.
Continue
Enter your password
Enter your password to finish setting up your account.
Continue
Activate your email
Enter activation code we sent to your email.
Submit
Reset your password
Enter activation code we sent to your email.
Submit
Set your new password
Enter a new password for your account.
Submit
Categories
For Business
Log in
Provide My Insights
Plotly
Plotly

Plotly Reviews, Pricing, Features & Alternatives (2026)

4.7/5
(3)

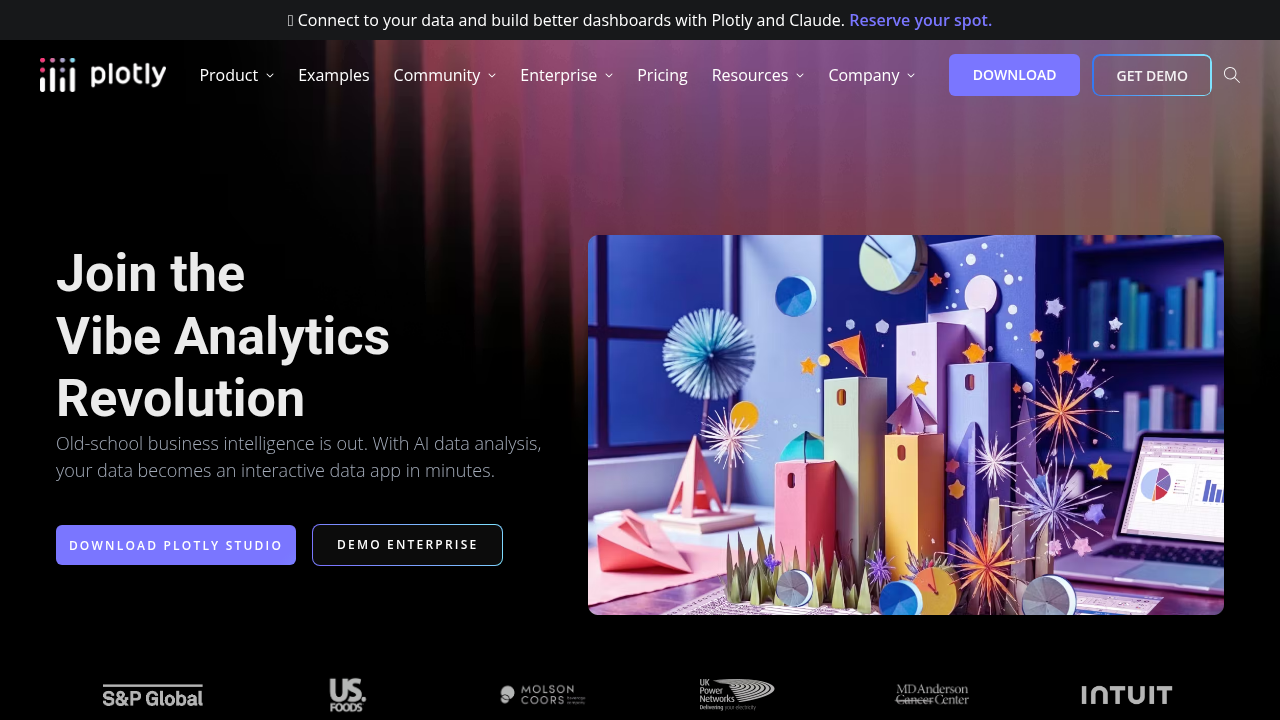
Plotly is a graphing and analytics platform enabling users to create interactive, high-quality visualizations quickly. It supports various chart types, real-time data updates, and seamless integration with programming languages like Python, R, and JavaScript. Designed for simplicity and scalability, it is ideal for individuals, teams, and enterprises to explore and present data effectively.

Plotly
Plotly
Plotly

Plotly Overview

What is Plotly?

4.7
3
Reviews
0%
Subscribed Score

Available for Claim - This listing is available to be claimed
Claim Profile For Free

Unclaimed

Manage profile with subsig, and unlock 23+ social and review monitoring. Get partnership options with

Claim Profile For Free

Why teams choose Plotly

Key Features

Affordable Pricing
Affordable Pricing
Transparent plans to fit any budget.
Secure by Design
Secure by Design
Data protection and compliance built in.
Collaborate Easily
Collaborate Easily
Built for teams and communication.

Who is Plotly for?

Plotly is a powerful data visualization solution designed to transform raw data into engaging, interactive, and publication-quality visual representations. As part of the Data Visualization category, Plotly stands out with its extensive suite of tools that cater to a diverse range of industries and user needs. Its platform allows users to create a variety of visual formats—from simple charts to complex multi-dimensional dashboards—making it an essential tool for data scientists, analysts, and developers who demand precision and clarity in their visual communication.

Why Use Plotly?

  • Interactive Visualizations: Plotly provides a robust environment for building interactive charts and graphs. Users can zoom, hover, and click on data points to explore information dynamically, resulting in more engaging presentations and insightful analysis.
  • Ease of Integration: With compatibility across multiple programming languages such as Python, R, and JavaScript, Plotly seamlessly integrates into your existing workflows. Its cohesive framework supports quick embedding into web applications and reports, enhancing overall usability.
  • Customization and Flexibility: The extensive customization options ensure that your visualizations can be tailored to meet specific branding standards and practical requirements. From color schemes to layout adjustments, Plotly gives you control over every aspect of your graphical presentation.
  • Collaboration and Sharing: Plotly’s platform is designed with collaboration in mind. Teams can work simultaneously on projects, share insights effortlessly, and utilize cloud-based functionalities to streamline data-driven decision-making processes.
  • Scalability and Performance: Whether you are visualizing small datasets or large-scale information arrays, Plotly is built to handle data-intensive operations without compromising speed or clarity, ensuring high performance even as data complexity grows.

Who is Plotly For?

  • Data Scientists and Analysts: Plotly is ideal for professionals who need to quickly transform complex datasets into accessible visuals, facilitating detailed analysis and trend identification.
  • Developers: With its strong API support and extensive documentation, developers can build custom data-driven applications and enhance user interfaces with visually compelling elements.
  • Business Decision-Makers: The intuitive design and powerful visual capabilities help executives and managers better understand key metrics and performance indicators, supporting strategic planning and decision-making.
  • Educators and Researchers: Plotly simplifies the process of presenting data in academic or research environments, making it easier to communicate findings through interactive charts and graphs.

Discover the benefits of streamlined and interactive visual data representations with Plotly. For a closer look at exclusive deals on Plotly, visit the deal page and see how this versatile platform can redefine your data visualization experience.

No alternatives are available in the provided list.

Plotly Summary

Plotly is a powerful data visualization solution designed to transform raw data into engaging, interactive, and publication-quality visual representations. As part of the Data Visualization category, Plotly stands out with its extensive suite of tools that cater to a diverse range of industries and user needs. Its platform allows users to create a variety of visual formats—from simple charts to complex multi-dimensional dashboards—making it an essential tool for data scientists, analysts, and developers who demand precision and clarity in their visual communication.

Why Use Plotly?

  • Interactive Visualizations: Plotly provides a robust environment for building interactive charts and graphs. Users can zoom, hover, and click on data points to explore information dynamically, resulting in more engaging presentations and insightful analysis.
  • Ease of Integration: With compatibility across multiple programming languages such as Python, R, and JavaScript, Plotly seamlessly integrates into your existing workflows. Its cohesive framework supports quick embedding into web applications and reports, enhancing overall usability.
  • Customization and Flexibility: The extensive customization options ensure that your visualizations can be tailored to meet specific branding standards and practical requirements. From color schemes to layout adjustments, Plotly gives you control over every aspect of your graphical presentation.
  • Collaboration and Sharing: Plotly’s platform is designed with collaboration in mind. Teams can work simultaneously on projects, share insights effortlessly, and utilize cloud-based functionalities to streamline data-driven decision-making processes.
  • Scalability and Performance: Whether you are visualizing small datasets or large-scale information arrays, Plotly is built to handle data-intensive operations without compromising speed or clarity, ensuring high performance even as data complexity grows.

Who is Plotly For?

  • Data Scientists and Analysts: Plotly is ideal for professionals who need to quickly transform complex datasets into accessible visuals, facilitating detailed analysis and trend identification.
  • Developers: With its strong API support and extensive documentation, developers can build custom data-driven applications and enhance user interfaces with visually compelling elements.
  • Business Decision-Makers: The intuitive design and powerful visual capabilities help executives and managers better understand key metrics and performance indicators, supporting strategic planning and decision-making.
  • Educators and Researchers: Plotly simplifies the process of presenting data in academic or research environments, making it easier to communicate findings through interactive charts and graphs.

Discover the benefits of streamlined and interactive visual data representations with Plotly. For a closer look at exclusive deals on Plotly, visit the deal page and see how this versatile platform can redefine your data visualization experience.

No alternatives are available in the provided list.

Plotly reviews and insights

Learn what people say about Plotly

4.7
3 Reviews
0%
Subscribed Score

Lear more here about the Subscribed score on how it is composed. Learn more Click here

Overall rating

5
4
3
2
1
CX 0/6

How good is the customer support based on subscribed’s assessment

CX Icon
Security 0/6

How secure is the product based on Subscribed’s assessment?

Security Icon
Ease of Use 0/6

How easy is the product to use, based on Subscribed’s assessment?

EOU Icon
Value 0/6

What is the value for money based on Subscribed’s assessment?

coin Icon
Integration 0/6

How many integrations does the product offer?

gear Icon
Popularity 0/6

How popular is the product?

star
4 months ago
Share
How does this compare to similar products you’ve tried?
What I like about this software is it allows me to create color coded and interactive charts through one single code. It is flexible and it makes works much more more easier. It is also quick in statistical operations,
What’s been frustrating in your experience?
Sometimes when you put large data, it won't work properly and I think that it needs to reduce the complexity of dash to compete with low code complexity.
If you could change one thing, what would it be?
I think they need to improve in automating the handling of datasets to prevent browser lag and add more features to make it more accessible.
Final thoughts, wrap up what you think
It is the best way to visualize arduino data and it gives 3D charts and real time data that Excel can't handle. So I would recommend this.
Upvote (2)
Jovie Macalolo-oy User Test Enabled
Executive / Leadership
See My Portfolio
4 months ago
Share
What’s the biggest benefit you’ve noticed?
The ability to turn complex Python scripts into professional, interactive web apps without needing a dedicated front-end team. It makes my data analysis feel much more impactful because stakeholders can actually play with the graphs and filters themselves instead of just looking at a static PDF.
What feels confusing or hard to use?
The transition from the open-source library to the Enterprise platform can be a bit overwhelming. Figuring out the specific permissioning and deployment workflows for the Dash Enterprise server took me some time to understand, especially when managing multiple environments.
What’s still missing for your needs?
I’d love to see even more "no-code" styling options for the layout in which I still find myself writing a lot of CSS to make the dashboards look exactly how I want.
Final thoughts, wrap up what you think
It’s great, scales well for big companies, and the charts just look better than almost anything else out there.
Upvote
Jiandale Ambal User Test Enabled
Full Stack Developer | QA Specialist | Embedded Systems Developer
See My Portfolio
4 months ago
Share
What’s the biggest benefit you’ve noticed?
The benefit is how easily it turns complex raw data into interactive charts. It makes presenting information to decision makers incredibly engaging.
Is there something that almost made you stop using it?
Learning the advanced API to build multi dimensional dashboards was challenging at first. The initial setup for web integrations felt overwhelming.
Is there a workflow that could be simpler?
I would love having more simple drag and drop templates ready to go. For me that would make building new data applications so much faster.
Final thoughts, wrap up what you think
I would highly recommend this platform to any data scientist needing publication quality visuals. For me it is the absolute best way to handle large scale information smoothly.
Upvote (3)
Plotly

Plotly User Reviews

3 User Reviews

Reviews from G2, Capterra, Trustpilot
info Icon

These ratings come directly from third-party platforms like G2, Capterra, and Trustpilot. They reflect real user feedback collected independently on those sites.

Plotly pricing

Pricing model

Plotly
Pricing Range
info Icon

This only an estimated pricing range, visit Plotly pricing page to access all the information by clicking “Visit Now”.

$0-199 / Month
Deals Available

This product comes with a special deal, see details

Visit Now
✨ Ask AI about pricing
No Score Subscribed Score

Overview

Plotly is a powerful data visualization solution designed to transform raw data into engaging, interactive, and publication-quality visual representations. As part of the Data Visualization category, Plotly stands out with its extensive suite of tools that cater to a diverse range of industries and user needs. Its platform allows users to create a variety of visual formats—from simple charts to complex multi-dimensional dashboards—making it an essential tool for data scientists, analysts, and developers who demand precision and clarity in their visual communication.

Why Use Plotly?

  • Interactive Visualizations: Plotly provides a robust environment for building interactive charts and graphs. Users can zoom, hover, and click on data points to explore information dynamically, resulting in more engaging presentations and insightful analysis.
  • Ease of Integration: With compatibility across multiple programming languages such as Python, R, and JavaScript, Plotly seamlessly integrates into your existing workflows. Its cohesive framework supports quick embedding into web applications and reports, enhancing overall usability.
  • Customization and Flexibility: The extensive customization options ensure that your visualizations can be tailored to meet specific branding standards and practical requirements. From color schemes to layout adjustments, Plotly gives you control over every aspect of your graphical presentation.
  • Collaboration and Sharing: Plotly’s platform is designed with collaboration in mind. Teams can work simultaneously on projects, share insights effortlessly, and utilize cloud-based functionalities to streamline data-driven decision-making processes.
  • Scalability and Performance: Whether you are visualizing small datasets or large-scale information arrays, Plotly is built to handle data-intensive operations without compromising speed or clarity, ensuring high performance even as data complexity grows.

Who is Plotly For?

  • Data Scientists and Analysts: Plotly is ideal for professionals who need to quickly transform complex datasets into accessible visuals, facilitating detailed analysis and trend identification.
  • Developers: With its strong API support and extensive documentation, developers can build custom data-driven applications and enhance user interfaces with visually compelling elements.
  • Business Decision-Makers: The intuitive design and powerful visual capabilities help executives and managers better understand key metrics and performance indicators, supporting strategic planning and decision-making.
  • Educators and Researchers: Plotly simplifies the process of presenting data in academic or research environments, making it easier to communicate findings through interactive charts and graphs.

Discover the benefits of streamlined and interactive visual data representations with Plotly. For a closer look at exclusive deals on Plotly, visit the deal page and see how this versatile platform can redefine your data visualization experience.

No alternatives are available in the provided list.

Subscribed Score Metrics
0/36 Metric achieved

Score Not Available
We are analyzing this product and the score will appear here

Plotly Pricing Range
$0-199 / Month

Plotly in action
info Icon

A curated gallery of real screenshots and use cases from the product, so you can see how it works before trying it.

Plotly Full Screen Icon
https://www.youtube.com/watch?v=asz-AqzajA8
Full Screen Icon
https://www.youtube.com/watch?v=GGL6U0k8WYA
Full Screen Icon
Plotly
Video thumbnail
Video thumbnail
Plotly

Alternatives to Plotly
info Icon

A list of platforms similar to Plotly, helping you evaluate which tool best matches your needs.

empty stats

No Alternatives Found

Looks like we cannot found any other relevant product at this moment

✨ Ask All alternative with AI

How to cancel Plotly

Need to cancel Plotly? Here is how
info Icon

Thinking about how to cancel Plotly this is how you do it!

Cancel Plotly Product:

  1. Visit your account settings at cloud.plotly.com/account
  2. Select "Delete account" option
  3. Confirm deletion when prompted

For Chart Studio Cloud, email [email protected] from your registered address requesting account deletion. Note that deletions are permanent and non-recoverable.

How to Cancel the Plotly

Cancel Plotly Product:

  1. Visit your account settings at cloud.plotly.com/account
  2. Select "Delete account" option
  3. Confirm deletion when prompted

For Chart Studio Cloud, email [email protected] from your registered address requesting account deletion. Note that deletions are permanent and non-recoverable.

FAQs about Plotly

Every else you need to know about Plotly
info Icon

A collection of FAQs, guides, alternatives, and comparisons to help you quickly understand if Plotly is right for you.

Manage your Plotly profile

Create profile

Want to list your product on Subscribed.fyi? Create a profile to reach more buyers.

Pricing Range
info Icon

This only an estimated pricing range, visit Plotly pricing page to access all the information by clicking “Visit Now”.

$0-199 / Month
Visit Now
Deals Available

This product comes with a special deal, see details

This product comes with a special deal, see details